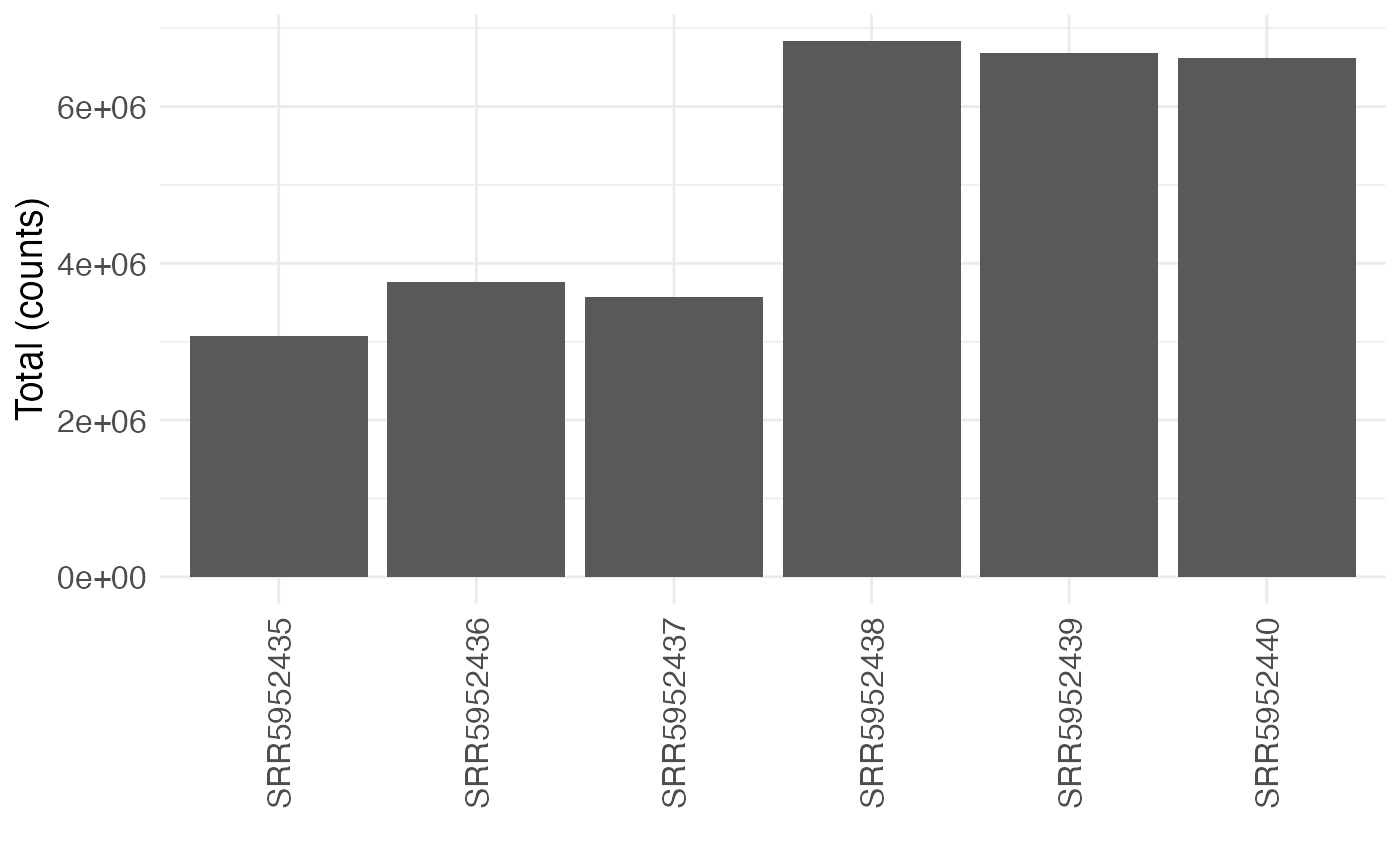
Plot the column totals of a selected assay
Arguments
- se
A
SummarizedExperimentobject, typically generated bysummarizeExperiment().- selAssay
Character scalar specifying the assay in
seto use for the plotting.- groupBy
Character scalar indicating a column in
rowData(se)to group the features by before calculating the column sums.
Examples
se <- readRDS(system.file("extdata", "GSE102901_cis_se.rds",
                          package = "mutscan"))[1:200, ]
plotTotals(se)