Overview
monaLisa was inspired by her father Homer to look for enriched motifs in sets (bins) of genomic regions, compared to all other regions (“binned motif enrichment analysis”).
It uses known motifs representing transcription factor binding preferences, for example for the JASPAR2020 Bioconductor package. The regions are for example promoters or accessible regions, which are grouped into bins according to a numerical value assigned to each region, such as change of expression or accessibility. The goal of the analysis is to identify transcription factors that are associated to that numerical value and thus candidates to be drivers in the underlying biological process.
In addition to the “binned motif enrichment analysis”, monaLisa can also be used to address the above question using stability selection (a form of linear regression), or to look for motif matches in sequences.
Current contributors include:
News
- information on the latest changes can be found here
- a preprint is available on bioRxiv
-
monaLisais available on Bioconductor -
monaLisais now published in Bioinformatics
Citation
To cite monaLisa please use the publication found here or see citation("monaLisa").
Installation
monaLisa can be installed from Bioconductor via the BiocManager package:
if (!requireNamespace("BiocManager", quietly = TRUE))
    install.packages("BiocManager")

BiocManager::install("monaLisa")
Functionality
Here is a minimal example to run a monaLisa analysis:
library(monaLisa)
mcparams <- BiocParallel::MulticoreParam(10L)
se <- calcBinnedMotifEnrR(seqs = seqs, # DNAStringSet (e.g. peak sequences)
bins = bins, # factor that groups 'seqs'
pwmL = pwms, # PWMatrixList (know motifs)
BPPARAM = mcparams,
min.score = 10,
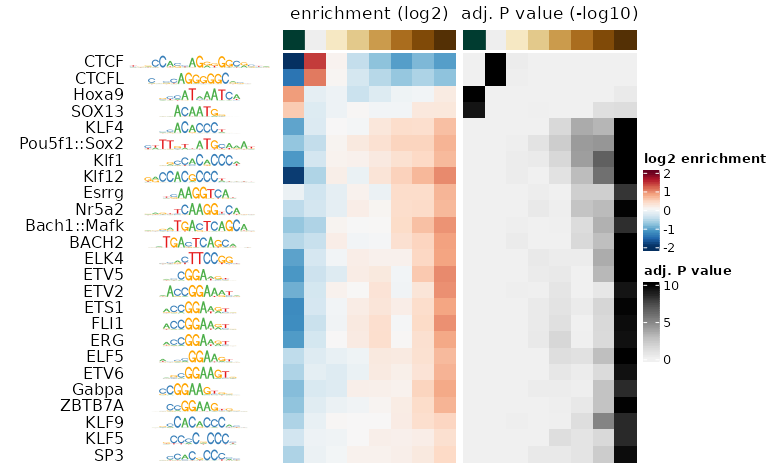
verbose = TRUE)The return value se is a SummarizedExperiment with motifs in rows and bins in columns, and multiple assays with significance and magnitude of the enrichments.
The inputs for calcBinnedMotifEnrR can be easily obtained using other Bioconductor packages:
# get sequences ('lmrs' is a GRanges object)
library(Biostrings)
library(BSgenome.Mmusculus.UCSC.mm10)
seqs <- getSeq(BSgenome.Mmusculus.UCSC.mm10, lmrs)

# bin sequences ('deltaMeth' is a numerical vector)
bins <- monaLisa::bin(x = deltaMeth, binmode = "equalN", nElement = 800)

# obtain known motifs from Jaspar
library(JASPAR2020)
library(TFBSTools)
pwms <- getMatrixSet(JASPAR2020, list(matrixtype = "PWM", tax_group = "vertebrates"))
The results can be conveniently visualized:
plotBinDensity(deltaMeth, bins, legendPosition = "none") +
    labs(x = "Methylation difference")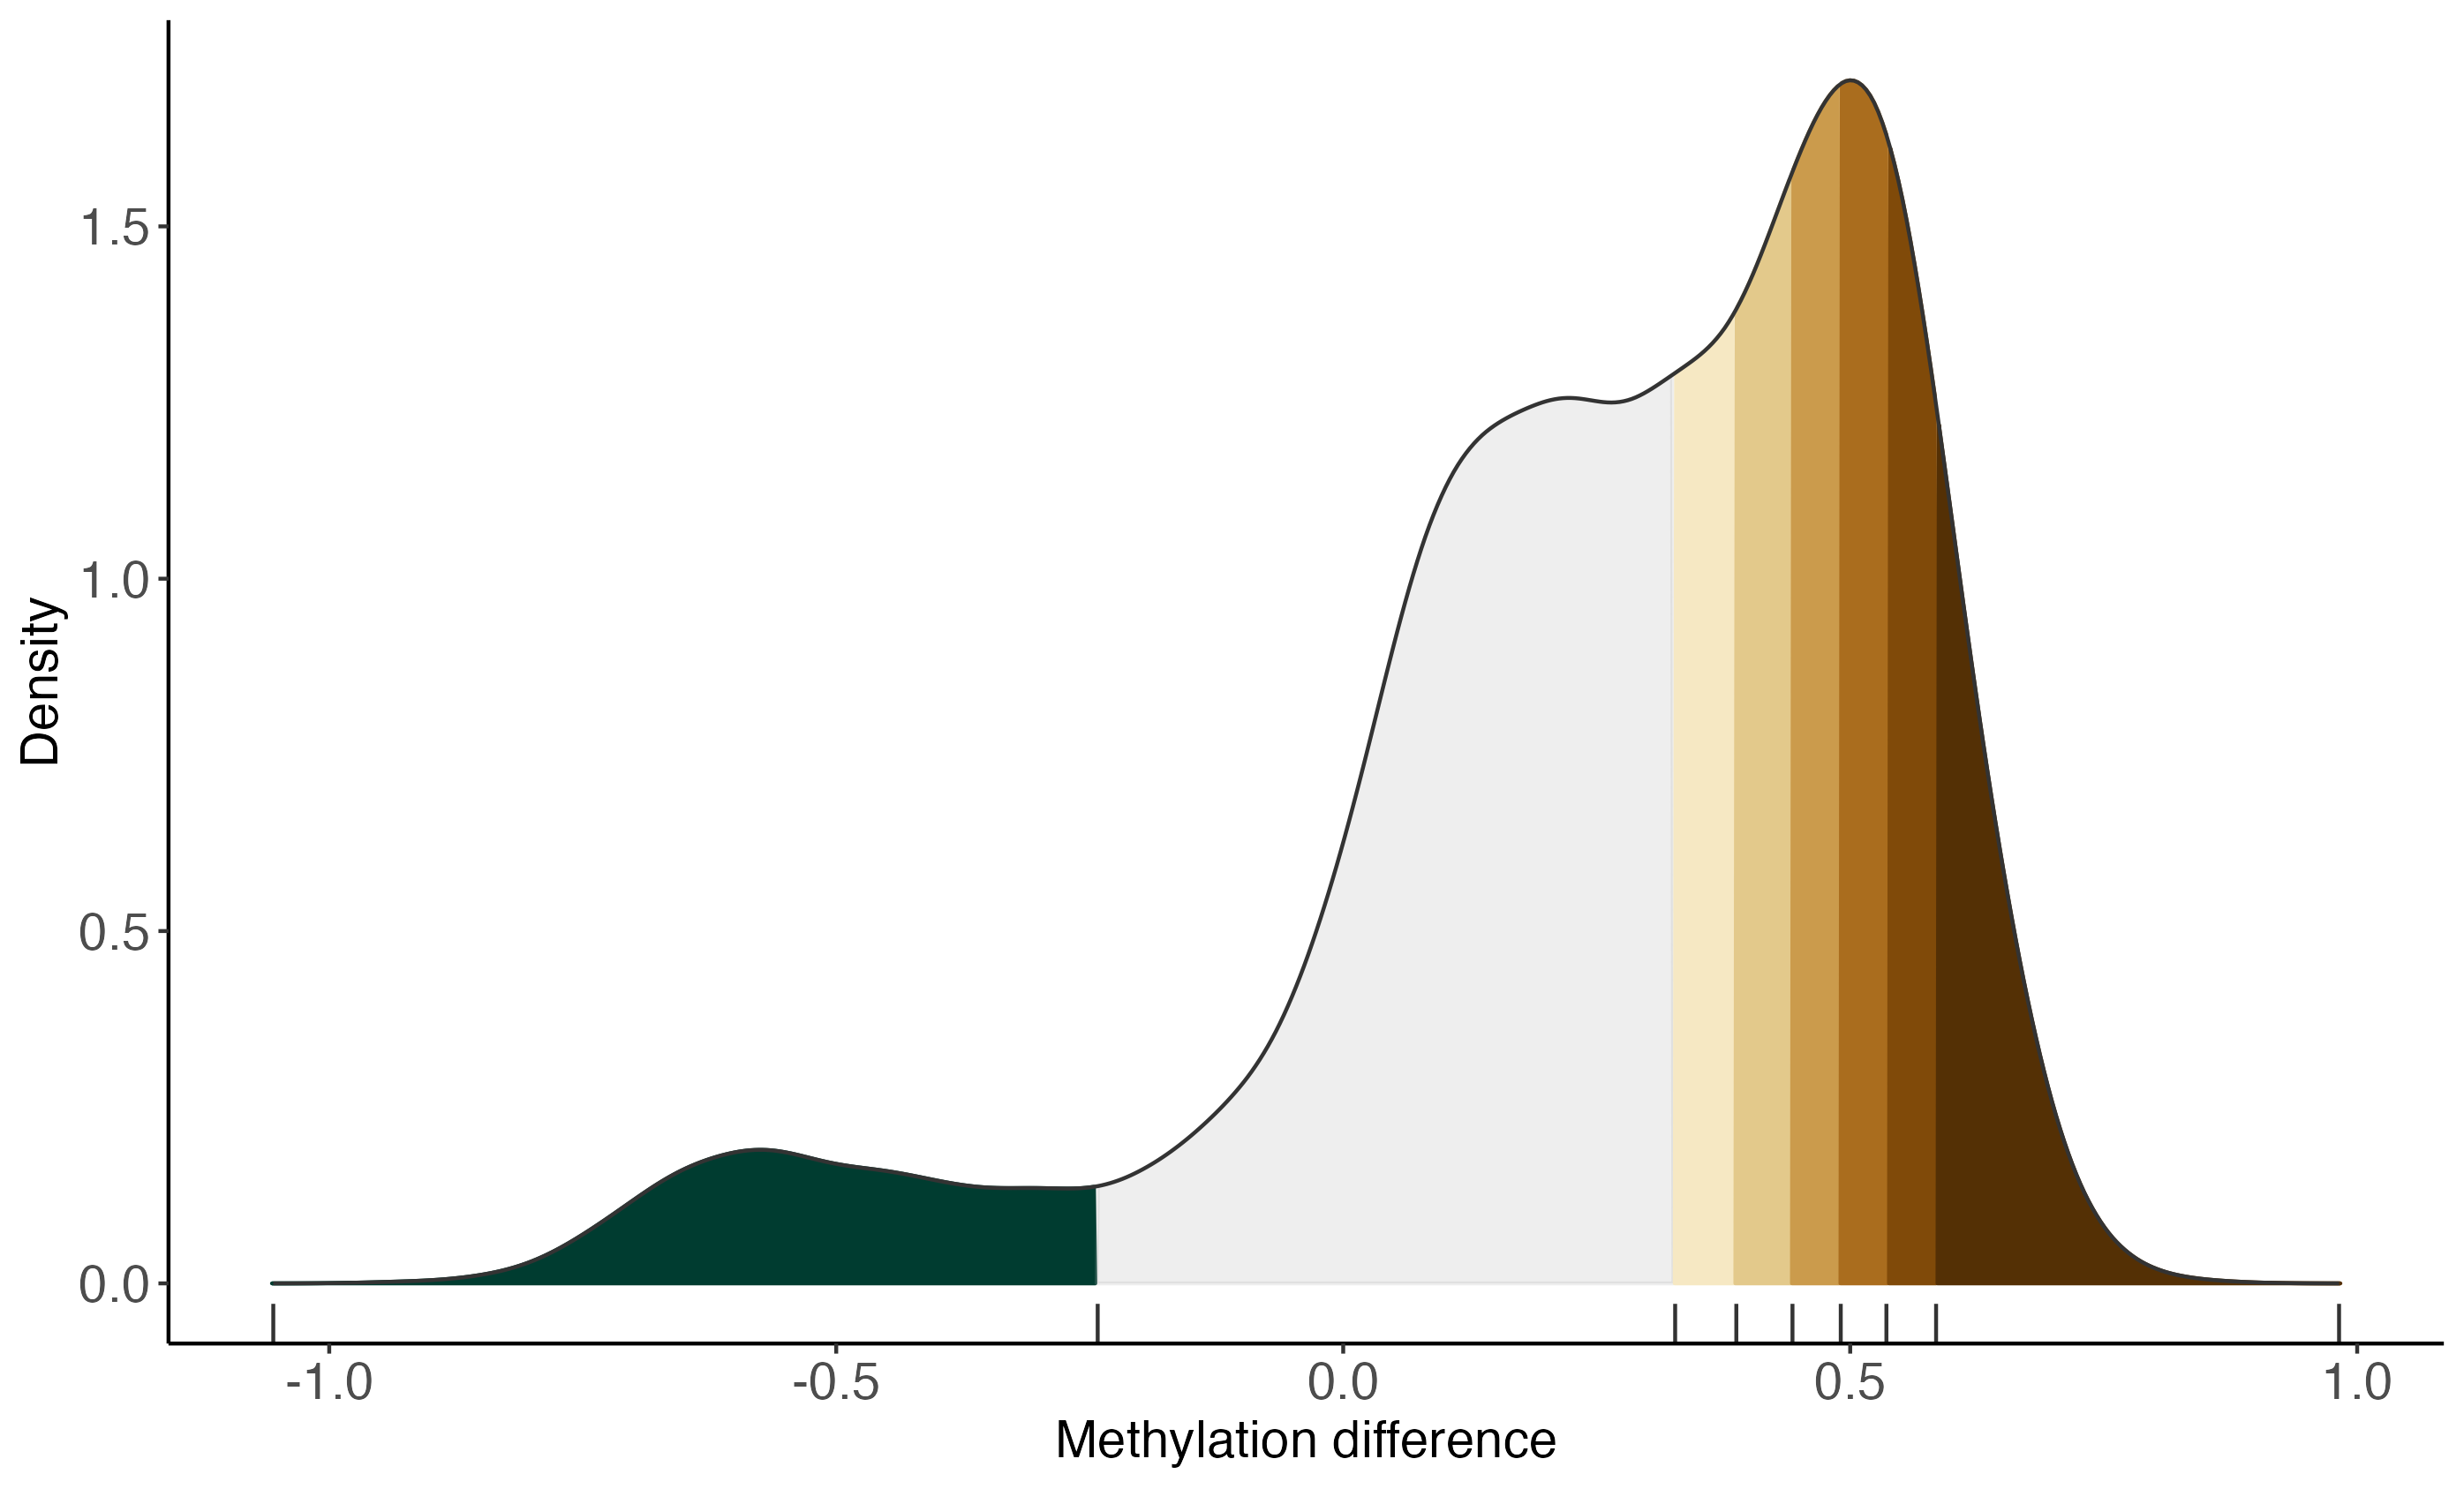
plotMotifHeatmaps(se, cluster = TRUE,
                  which.plots = c("enr", "FDR"),
                  show_seqlogo = TRUE)