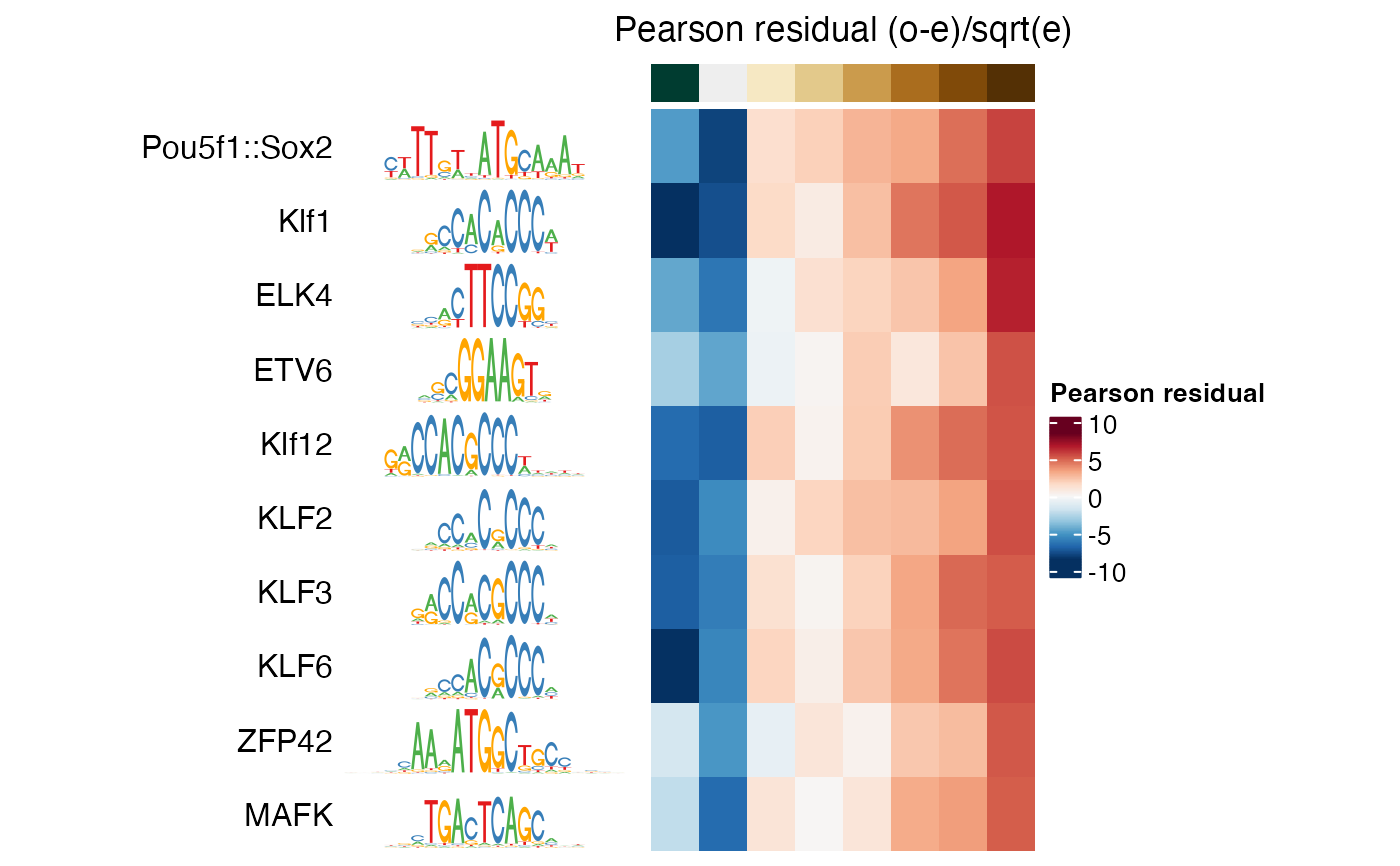
Plot motif enrichments (e.g. significance or magnitude) as a heatmap.
Usage
plotMotifHeatmaps(
  x,
  which.plots = c("negLog10P", "pearsonResid", "negLog10Padj", "log2enr"),
  width = 4,
  col.enr = c("#053061", "#2166AC", "#4393C3", "#92C5DE", "#D1E5F0", "#F7F7F7",
    "#FDDBC7", "#F4A582", "#D6604D", "#B2182B", "#67001F"),
  col.sig = c("#F0F0F0", "#D9D9D9", "#BDBDBD", "#969696", "#737373", "#525252",
    "#252525", "#000000"),
  col.gc = c("#F7FCF5", "#E5F5E0", "#C7E9C0", "#A1D99B", "#74C476", "#41AB5D", "#238B45",
    "#006D2C", "#00441B"),
  maxEnr = NULL,
  maxSig = NULL,
  highlight = NULL,
  cluster = FALSE,
  show_dendrogram = FALSE,
  show_motif_GC = FALSE,
  show_seqlogo = FALSE,
  show_bin_legend = FALSE,
  width.seqlogo = 1.5,
  use_raster = FALSE,
  na_col = "white",
  doPlot = TRUE,
  ...
)
Arguments
- x
A
SummarizedExperimentwith numerical matrices (motifs-by-bins) in itsassays(), typically the return value ofcalcBinnedMotifEnrRorcalcBinnedMotifEnrHomer.- which.plots
Selects which heatmaps to plot (one or several from
"negLog10P","negLog10Padj","pearsonResid"and"log2enr").- width
The width (in inches) of each individual heatmap, without legend.
- col.enr
Colors used for enrichment heatmap ("pearsonResid" and "log2enr").
- col.sig
Colors used for significance hetmaps ("negLog10P" and "negLog10Padj").
- col.gc
Colors used for motif GC content (for
show_motif_GC = TRUE).- maxEnr
Cap color mapping at enrichment =
maxEnr(default: 99.5th percentile).- maxSig
Cap color mapping at -log10 P value or -log10 FDR =
maxSig(default: 99.5th percentile).- highlight
A logical vector indicating motifs to be highlighted.
- cluster
If
TRUE, the order of transcription factors will be determined by hierarchical clustering of the"pearsonResid"component. Alternatively, anhclust-object can be supplied which will determine the motif ordering. No reordering is done forcluster = FALSE.- show_dendrogram
If
cluster != FALSE, controls whether to show a row dendrogram for the clustering of motifs. Ignored forcluster = FALSE.- show_motif_GC
If
TRUE, show a column with the percent G+C of the motif as part of the heatmap.- show_seqlogo
If
TRUE, show a sequence logo next to each motif label. This will likely only make sense for a heatmap with a low number of motifs.- show_bin_legend
If
TRUE, show a legend for the bin labels. If FALSE (default), the bin legend will be hidden.- width.seqlogo
The width (in inches) for the longest sequence logo (shorter logos are drawn to scale).
- use_raster
TRUEorFALSE(default). Passed touse_rasterofHeatmap.- na_col
"white" (default). Passed to
na_colofHeatmap.- doPlot
If
TRUE(default), plot the generated heatmap(s) usingReduce(ComplexHeatmap::add_heatmap, heatmapList). IfFALSE, just return the list of heatmap(s) (heatmapList) in example before), allowing to modify them further before plotting.- ...
Further arguments passed to
Heatmapwhen creating the main heatmaps selected bywhich.plots. For example, the following will set the font size of the motif names:plotMotifHeatmaps(..., row_names_gp = gpar(fontsize = 12))
Value
A list of ComplexHeatmap::Heatmap objects.
Details
The heatmaps are created using the ComplexHeatmap package and plotted side-by-side.
Each heatmap will be width inches wide, so the total plot needs a
graphics device with a width of at least
length(which.plots) * width plus the space used for motif names
and legend. The height will be auto-adjusted to the graphics device.
References
Gu, Z. Complex heatmaps reveal patterns and correlations in multidimensional genomic data. Bioinformatics 2016.
Examples
se <- readRDS(system.file("extdata",
                          "results.binned_motif_enrichment_LMRs.rds",
                          package = "monaLisa"))
i <- which(SummarizedExperiment::assay(se, "negLog10Padj")[, 8] > 4)
plotMotifHeatmaps(se[i, ], which.plots = "pearsonResid",
                  width = 2, show_seqlogo = TRUE)