Visualize query results as violin plots
plotQueryResultsViolin.RdVisualize query results as violin plots
plotQueryResultsViolin(queryResults, doPlot = TRUE)Arguments
Value
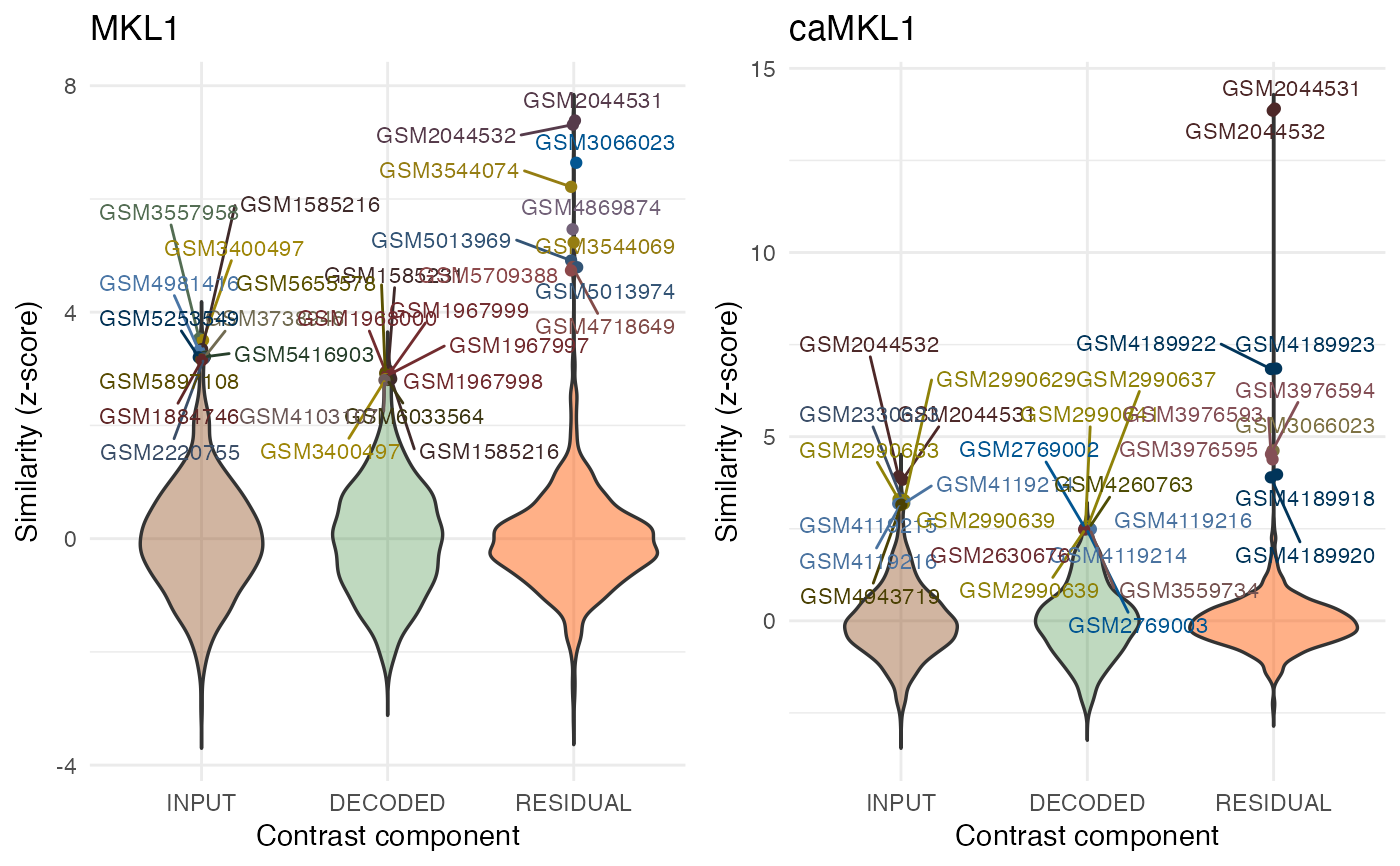
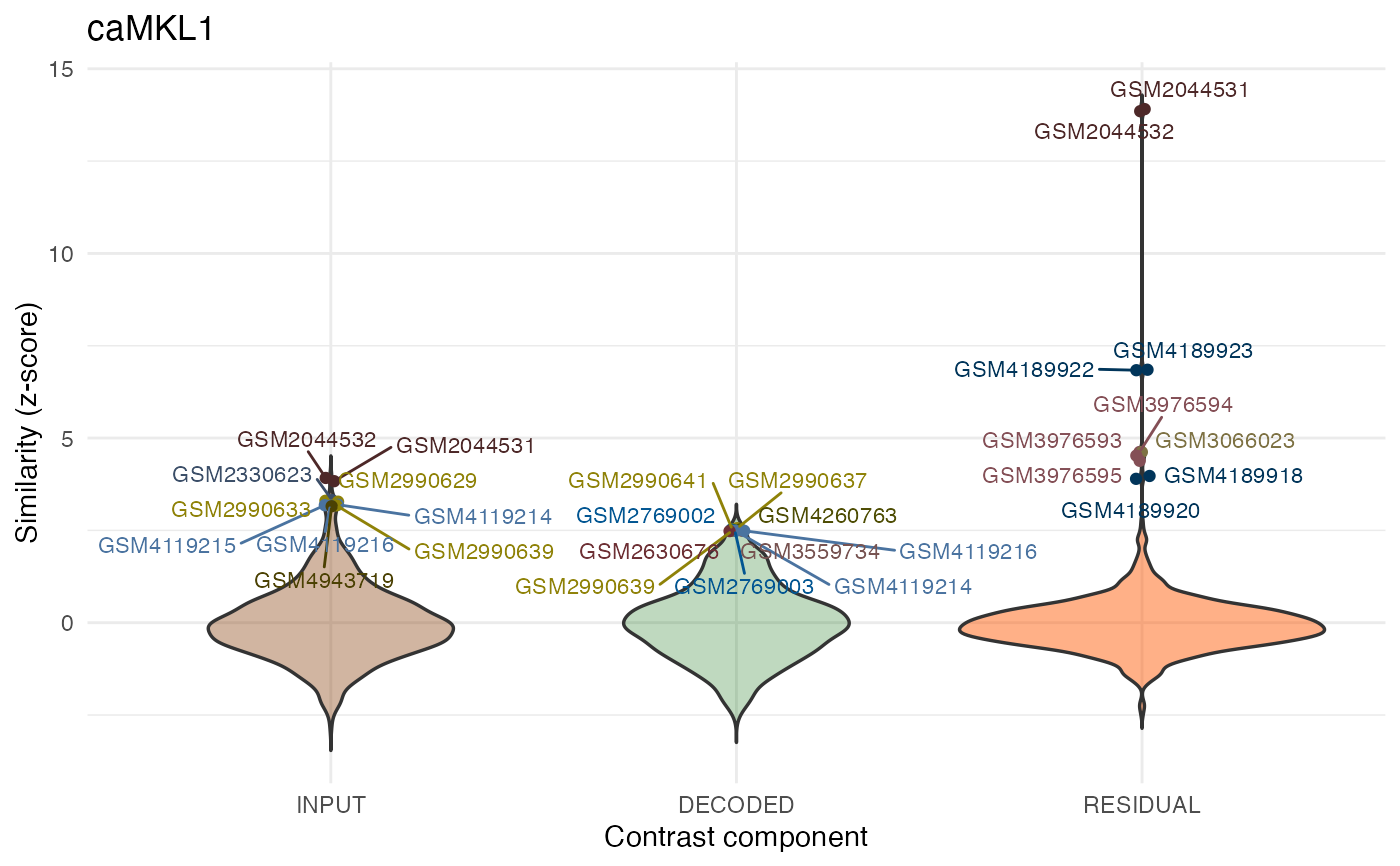
A list of ggplot violin plots (one for each dataset) for the scores of queries using different contrast components against the respective contrast DBs.
Examples
MKL1_human <- readRDS(system.file("extdata", "GSE215150_MKL1_Human.rds",
package = "orthos"))

# Decompose contrasts:
dec_MKL1_human <- decomposeVar(M = MKL1_human, treatm = c(2, 3), cntr = c(1, 1),
                              organism = "Human", verbose = FALSE)
#> see ?orthosData and browseVignettes('orthosData') for documentation
#> loading from cache
#> see ?orthosData and browseVignettes('orthosData') for documentation
#> loading from cache
#> see ?orthosData and browseVignettes('orthosData') for documentation
#> loading from cache

# Perform query against contrast DB with the decomposed fractions.
# !!!Note!!! mode="DEMO" for demonstration purposes only.
params <- BiocParallel::MulticoreParam(workers = 2)
query.res.human <- queryWithContrasts(dec_MKL1_human, organism = "Human",
                                     BPPARAM = params, verbose = FALSE,
                                     mode = "DEMO")
#> demo_decomposed_contrasts_human_rds  already present in cache at: /Users/runner/Library/Caches/org.R-project.R/R/ExperimentHub/human_v212_NDF_c100_DEMOse.rds
#> demo_decomposed_contrasts_human_hdf5  already present in cache at: /Users/runner/Library/Caches/org.R-project.R/R/ExperimentHub/human_v212_NDF_c100_DEMOassays.h5


# plot results for individual contrasts using violin plots::
ViolinPlots <- plotQueryResultsViolin(query.res.human, doPlot = FALSE)
ViolinPlots[["caMKL1"]]
