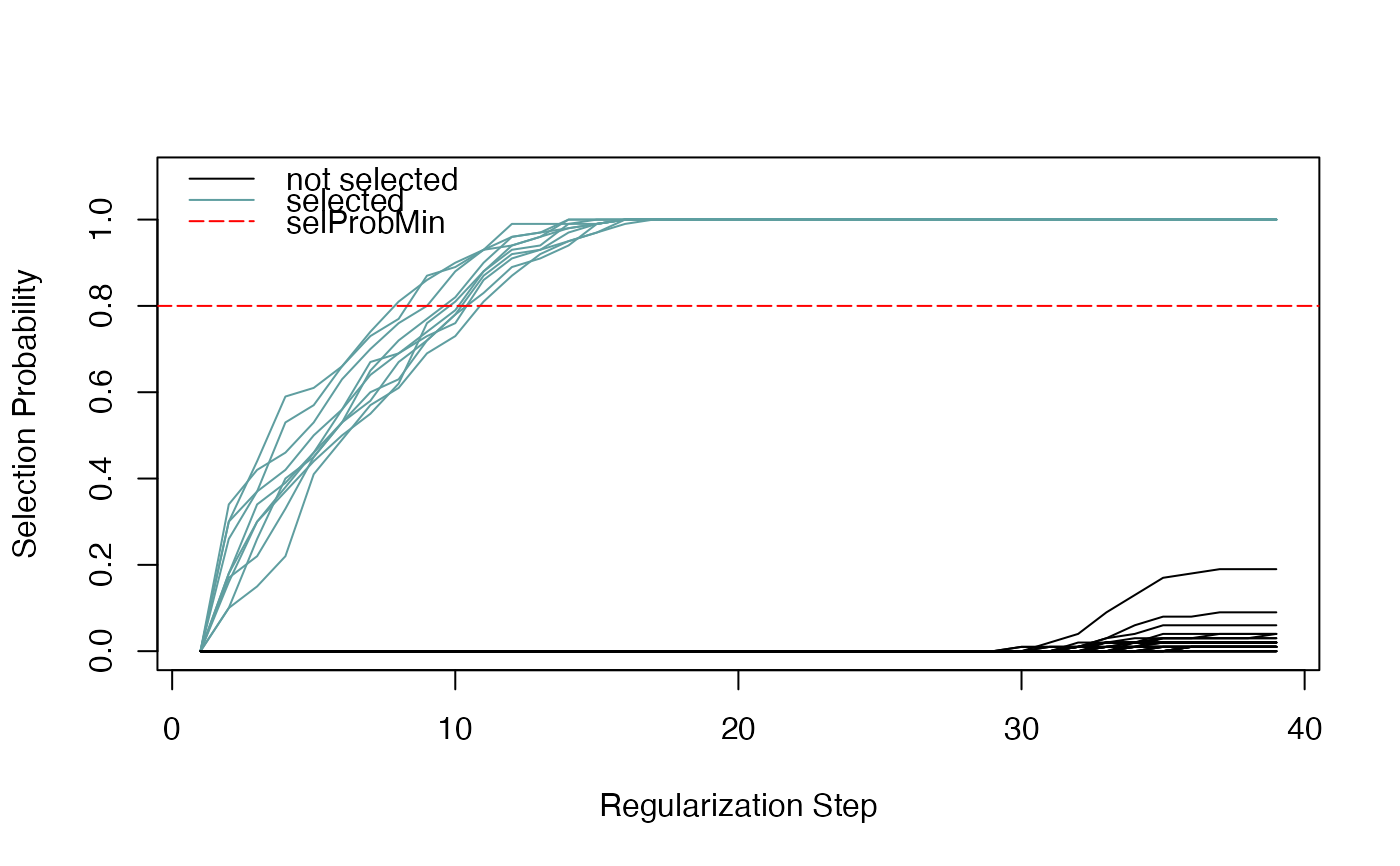
Plot the stability paths of each variable (predictor), showing the selection probability as a function of the regularization step.
Arguments
- se
The
SummarizedExperimentobject resulting from stability selection, by runningrandLassoStabSel.- selProbMin
A numerical scalar in [0,1]. Predictors with a selection probability greater than
selProbMinare shown as colored lines. The color is defined by thecolargument.- selColor
Color for the selected predictors which have a selection probability greater than
selProbMin.- notSelColor
Color for the rest of the (un-selected) predictors.
- selProbCutoffColor
Color for the line depicting the selection probability cutoff.
- linewidth
Line width.
- alpha
Line transparency of the stability paths.
- ylim
Limits for y-axis.
- labelPaths
If
TRUE, the predictor labels will be shown at the end of the stability paths. The predictor labels given inlabelswill be shown. If unspecified, the labels corresponding to the selected predictors will be added. If predictors have the same y-value in the last regularization step, the labels will be shown in a random order. One needs to useset.seedto reproduce the plot in this case.- labels
If
labelPaths = TRUE, the predictors which should be labelled. IfNULL, the selected predictors greater thanmetadata(se)$stabsel.params.cutoffwill be shown.- labelNudgeX
If
labelPaths = TRUE, how much to nudge the labels to the right of the x-axis.- labelSize
If
labelPaths = TRUE, the size of the labels.
Examples
## create data set
Y <- rnorm(n = 500, mean = 2, sd = 1)
X <- matrix(data = NA, nrow = length(Y), ncol = 50)
for (i in seq_len(ncol(X))) {
  X[ ,i] <- runif(n = 500, min = 0, max = 3)
}
s_cols <- sample(x = seq_len(ncol(X)), size = 10,
  replace = FALSE)
for (i in seq_along(s_cols)) {
  X[ ,s_cols[i]] <- X[ ,s_cols[i]] + Y
}

## reproducible randLassoStabSel() with 1 core
set.seed(123)
ss <- randLassoStabSel(x = X, y = Y)
plotStabilityPaths(ss)