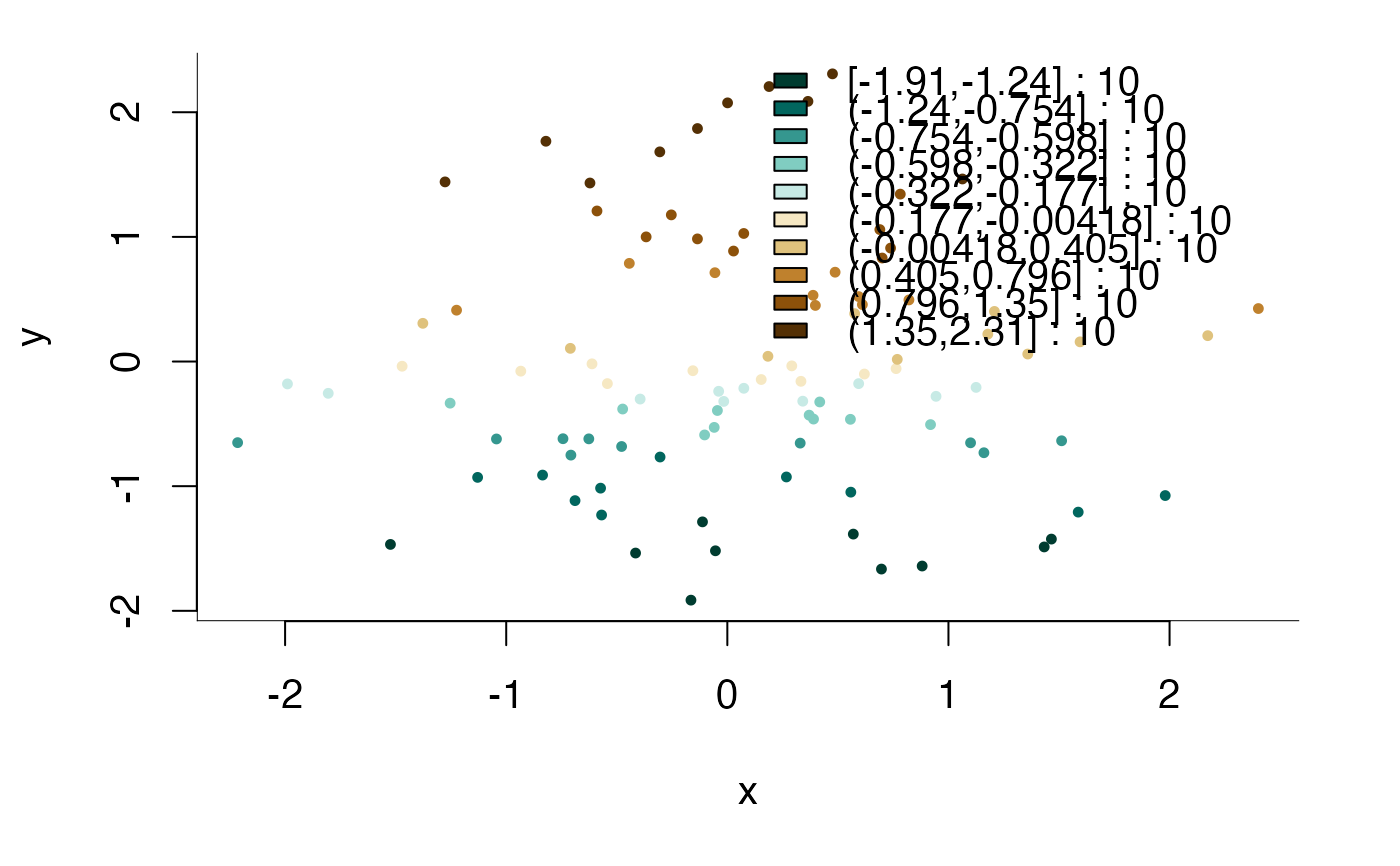
Plot a scatter (xy-plot) of binned elements with binning information.
Usage
plotBinScatter(
  x,
  y,
  b,
  cols = NULL,
  xlab = deparse(substitute(x, env = as.environment(-1))),
  ylab = deparse(substitute(y, env = as.environment(-1))),
  main = "",
  legendPosition = "right",
  legend = NULL,
  legend.cex = NULL,
  ...
)
Arguments
- x
A numerical vector with x values.
- y
A numerical vector with y values (the values used for binning).
- b
A factor that groups elements of
x,yinto bins (typically the output ofbin(y)).- cols
NULLor a color vector defining the colors of points. IfNULL, the colors will be computed based onbusinggetColsByBin(b)).- xlab
Label for x-axis.
- ylab
Label for y-axis.
- main
Main title.
- legendPosition
A
characterscalar. If not"none", draw a legend with binning information. The value is used to control the legend position and will be passed totheme(legend.position = legendPosition).- legend
Deprecated (ignored). Please use
legendPositionto control the drawing and position of the legend.- legend.cex
Deprecated (ignored). You can use
themeto set legend and other graphical parameters.- ...
Further arguments passed to
getColsByBin(only used ifcolsisNULL).