Plot various diagnostics of binned sequences. Three plot types are available:
lengthplots the distribution of sequence lengths within each bin.
GCfracplots the distribution of GC fractions within each bin.
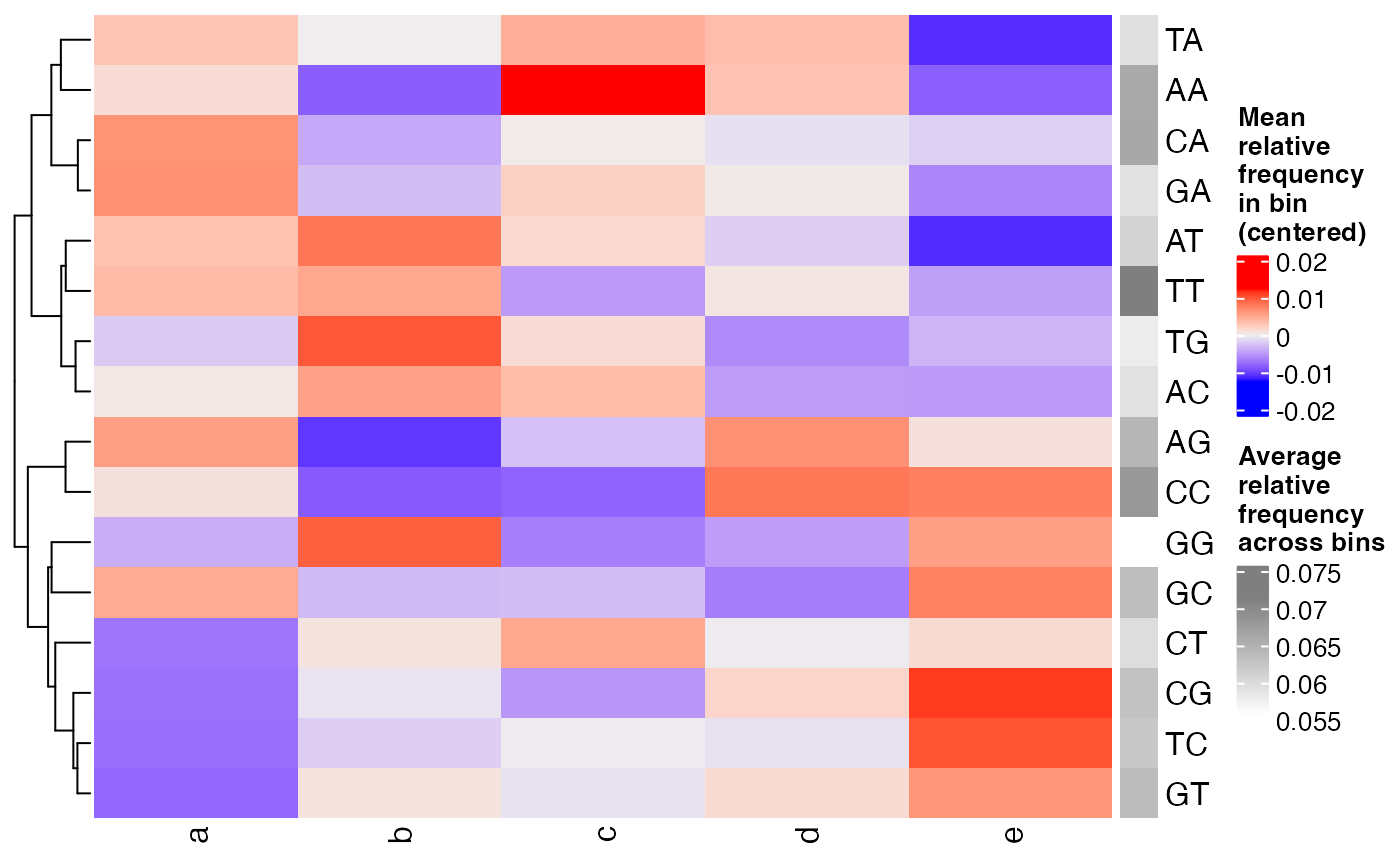
dinucfreqplots a heatmap of the relative frequency of each dinucleotide, averaged across the sequences within each bin. The values are centered for each dinucleotide to better highlight differences between the bins. The average relative frequency of each dinucleotide (across the bins) is indicated as well.
Arguments
- seqs
DNAStringSetobject with sequences.- bins
Factor of the same length and order as
seqs, indicating the bin for each sequence. Typically the return value ofbin.- aspect
The diagnostic to plot. Should be one of
"length","GCfrac"and"dinucfreq", to plot the distribution of sequence lengths, the distribution of GC fractions and the average relative dinucleotide frequencies across the bins.- draw_quantiles
For aspect=
"length"or"GCfrac", draw vertical lines at the given quantiles of the density estimate. IfNULL, no quantile lines will be drawn.- ...
Additional argument passed to
getColsByBin.
Value
For aspect="length" or "GCfrac", returns a
ggplot object. For aspect="dinucfreq",
returns (invisibly) a Heatmap-class object.
Examples
seqs <- Biostrings::DNAStringSet(
vapply(1:250, function(i) paste(sample(x = c("A", "C", "G", "T"),
size = round(stats::rnorm(1, 20, 5)),
replace = TRUE), collapse = ""), "")
)
bins <- factor(rep(c("a", "b", "c", "d", "e"), each = 50))
plotBinDiagnostics(seqs, bins, aspect = "length")
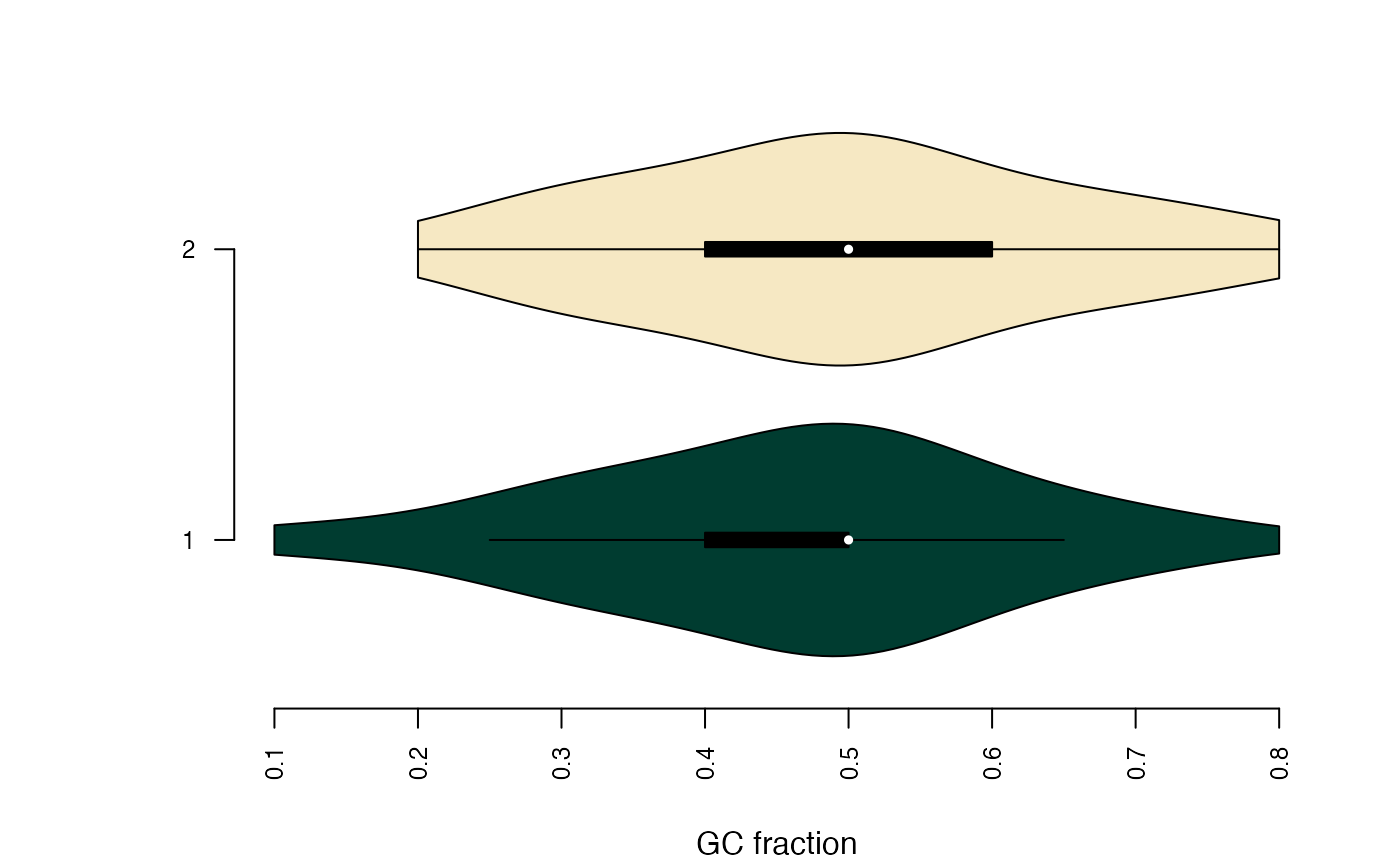 plotBinDiagnostics(seqs, bins, aspect = "GCfrac", draw_quantiles = NULL)
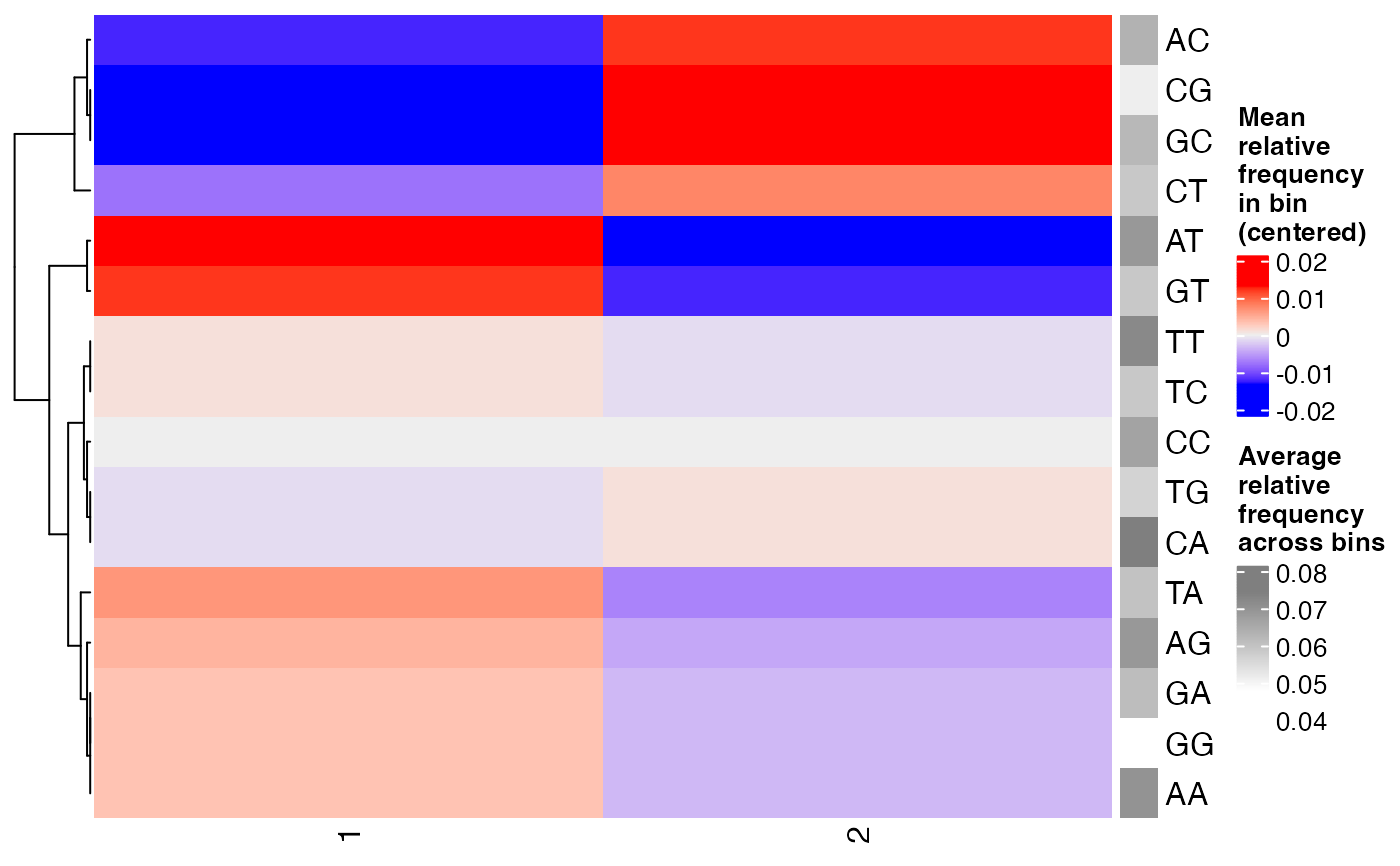 plotBinDiagnostics(seqs, bins, aspect = "dinucfreq")