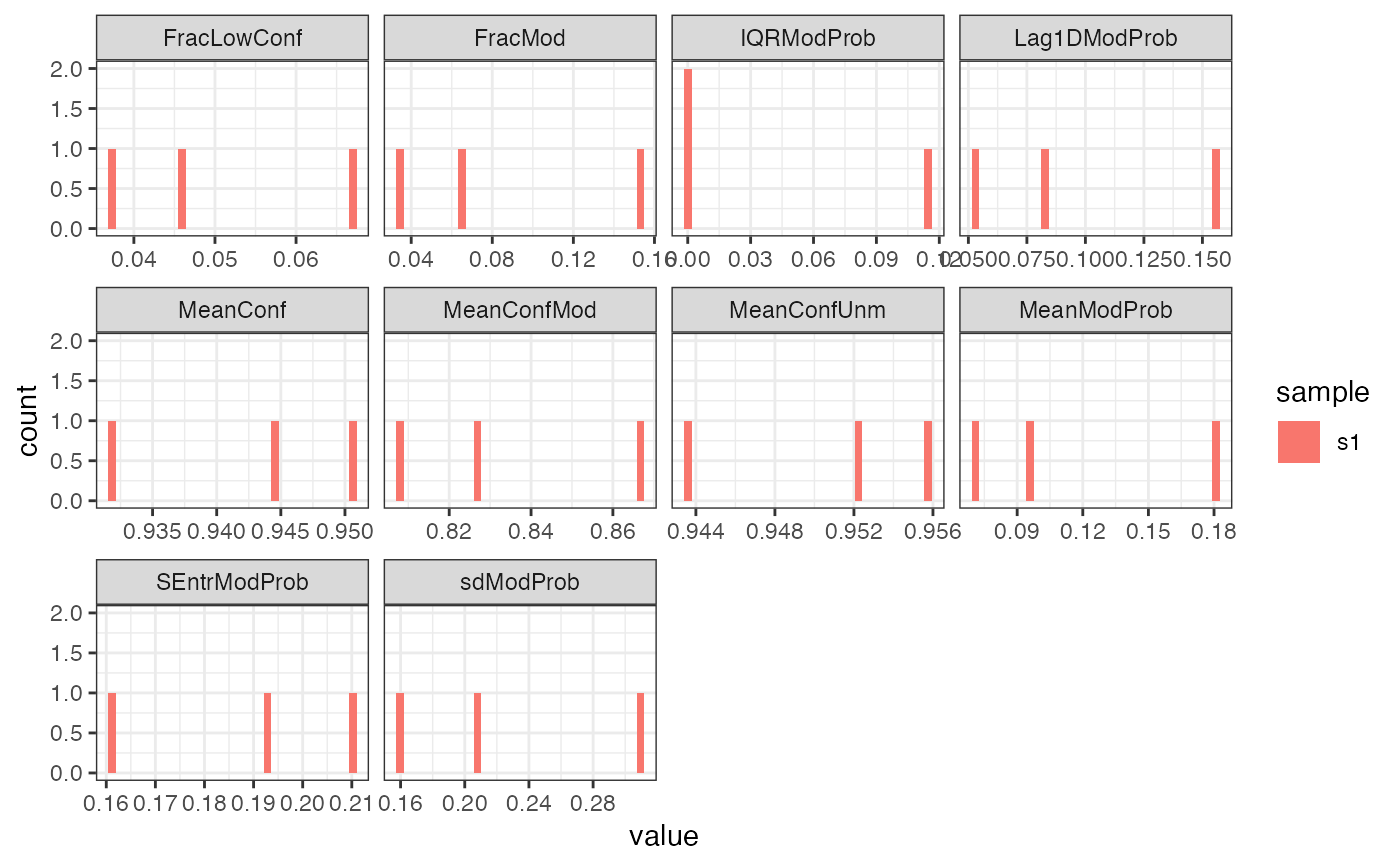
This function plots histograms of the various per-read summary statistics
calculated by addReadStats.
Usage
plotReadStats(
  se,
  readInfoCol = "readInfo",
  qcCol = "QC",
  minQscore = NULL,
  maxEntropy = NULL,
  maxFracLowConf = NULL,
  minReadLength = NULL,
  minAlignedLength = NULL,
  minAlignedFraction = NULL,
  minSNR = NULL
)
Arguments
- se
A
RangedSummarizedExperiment, typically generated byaddReadStats.- readInfoCol
A character scalar providing the name of the column in
colDatathat contains read info. Can beNULLif no such column exists.- qcCol
A character scalar providing the name of the column in
colDatathat contains quality metrics (calculated bycalcReadStats). Can beNULLif no such column exists.- minQscore, maxEntropy, maxFracLowConf, minReadLength, minAlignedLength, minAlignedFraction, minSNR
Numeric scalars representing possible threshold values used in
filterReads, for illustration in the plot panels.
Examples
library(SummarizedExperiment)
modbamfiles <- system.file("extdata",
                           c("6mA_1_10reads.bam", "6mA_2_10reads.bam"),
                          package = "footprintR")
se <- readModBam(bamfile = modbamfiles, regions = "chr1:6940000-6955000",
                 modbase = "a", verbose = TRUE,
                 BPPARAM = BiocParallel::SerialParam())
#> ℹ extracting base modifications from modBAM files
#> ⠙ 0.000 Mio. genomic positions processed (0.001 Mio./s) [2ms]

#> ⠙ 0.000 Mio. genomic positions processed (0.001 Mio./s) [1ms]
#> ℹ finding unique genomic positions...
#> ✔ finding unique genomic positions... [31ms]
#>
#> ⠙ 0.000 Mio. genomic positions processed (0.001 Mio./s) [1ms]

#> ℹ collapsed 17739 positions to 7967 unique ones
#> ✔ collapsed 17739 positions to 7967 unique ones [325ms]
#>
#> ⠙ 0.000 Mio. genomic positions processed (0.001 Mio./s) [1ms]

se <- addReadStats(se, BPPARAM = BiocParallel::SerialParam())
#> Warning: Too few points to estimate noise floor (1); raw noise variances are used.
#> Warning: Too few points to estimate noise floor (0); raw noise variances are used.
plotReadStats(se)