Plot distances bwtween modified bases and annotate it with estimated nucleosome repeat length (NRL).
Arguments
- x
numericvector giving the counts of distances between modified bases on the same read (typically calculated bycalcModbaseSpacing.- hide
If
TRUE(the default), hide distance counts not used in the NRL estimate (minDistparameter fromestimateNRL).- xlim
numeric(2)with the x-axis (distance) limits in the first two plots (see Details). ifNULL(the default), the full range defined byxandhidewill be used.- base_size
Numeric scalar defining the base font size in pts.
- detailedPlots
If
TRUE, create three plots instead of just a single plot (see Details).- ...
Additional arguments passed to
estimateNRLto control NRL estimation.
Value
A ggplot object.
Details
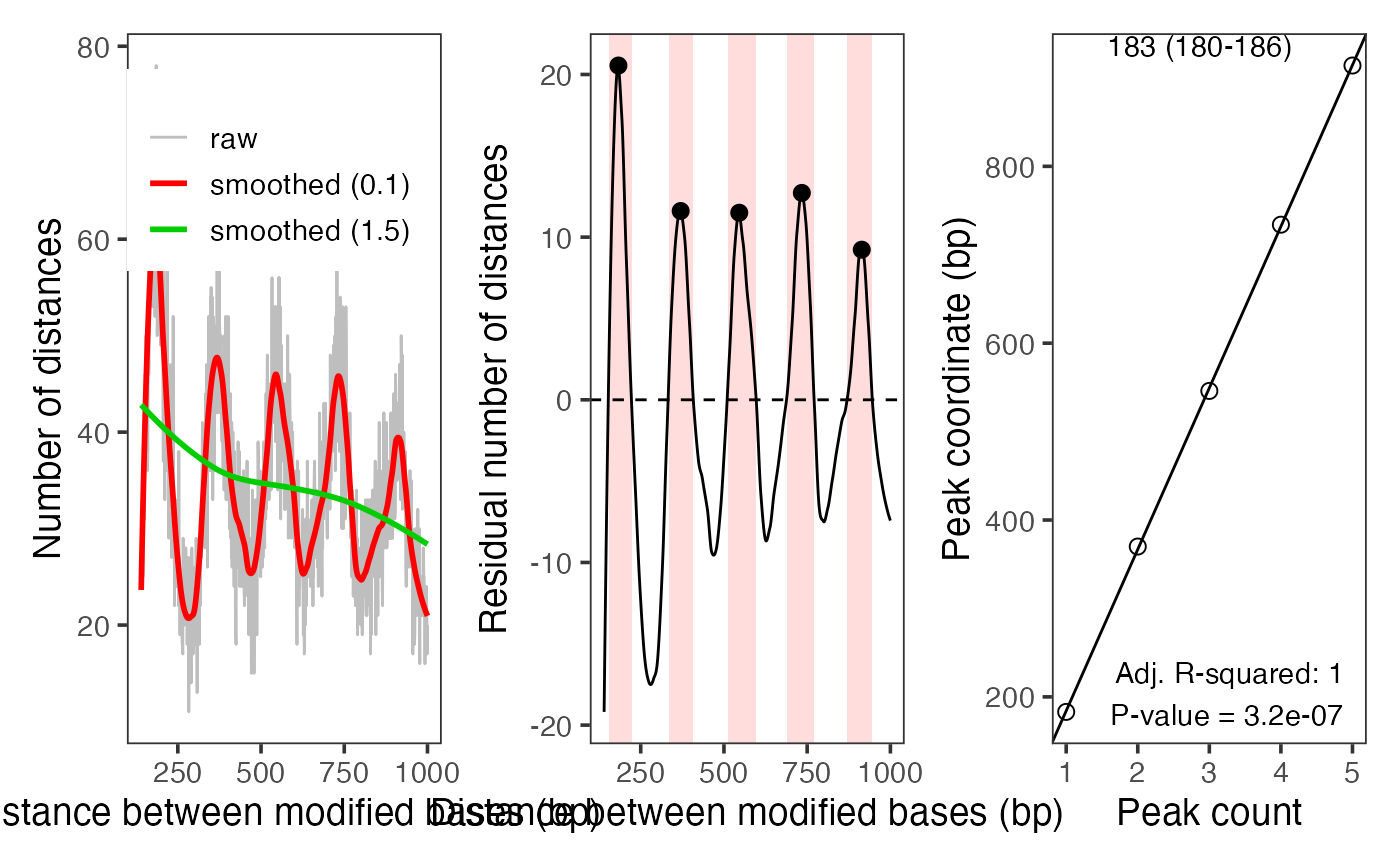
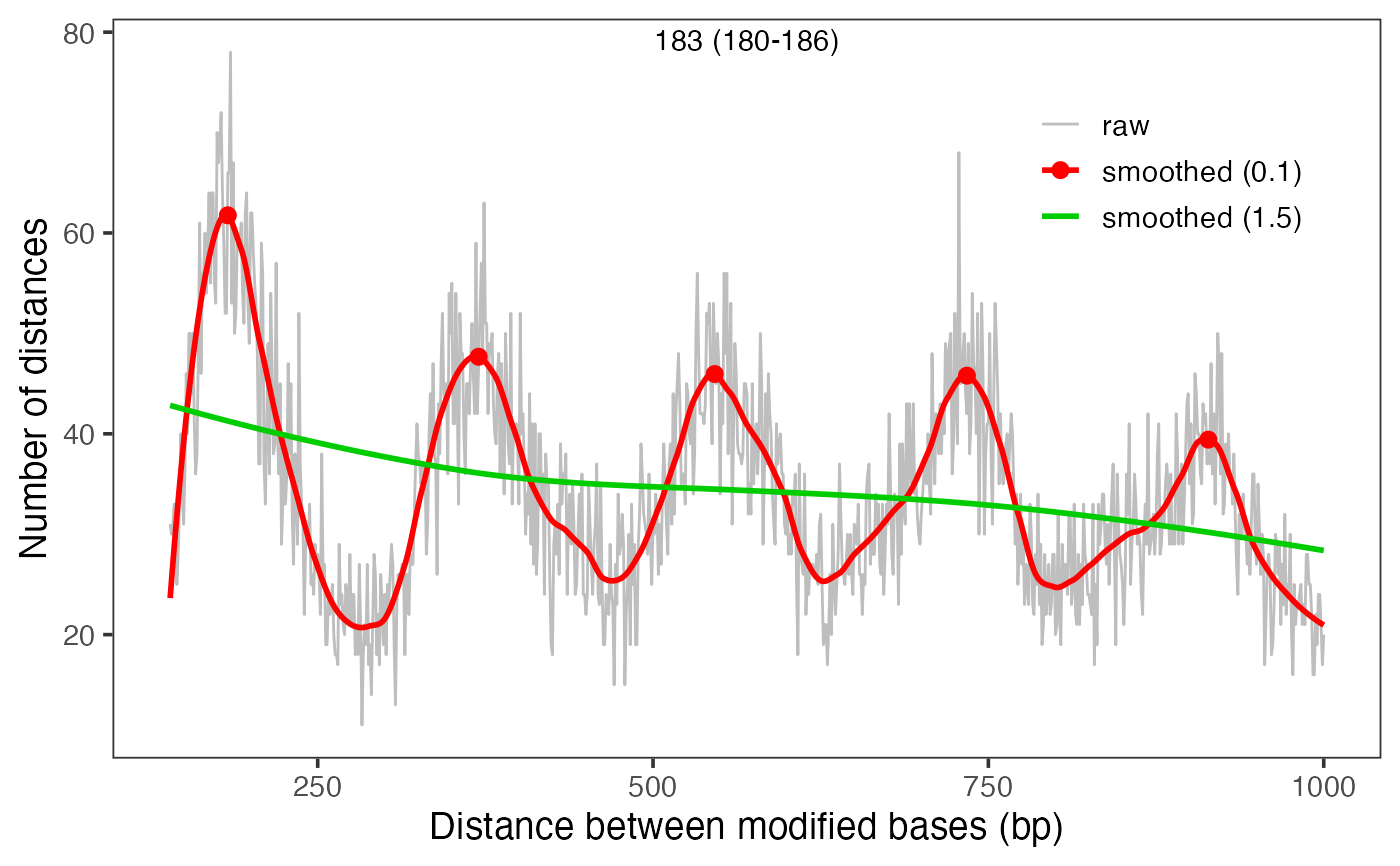
The function will visualize an annotated distance frequencies
between modified bases. For detailedPlots=FALSE (the default), it
will create a single annotated plot. For detailedPlots=TRUE, it will
create three plots (using par(mfrow=c(1,3))):
raw phase counts with de-trending and de-noising loess fits
residual phase counts with de-noising loess fit and detected peaks
linear fit to peaks and NRL estimation
See also
calcModbaseSpacing to calculate the distance
frequencies from base modification data, estimateNRL to
estimate nucleosome repeat length.
Examples
modbamfiles <- system.file("extdata",
                           c("6mA_1_10reads.bam", "6mA_2_10reads.bam"),
                           package = "footprintR")
se <- readModBam(modbamfiles, "chr1:6940000-6955000", "a",
                 BPPARAM = BiocParallel::SerialParam())

# get distances for each sample
moddist <- calcModbaseSpacing(se)

# analyze and plot NRL for sample 's1'
plotModbaseSpacing(moddist$s1)

plotModbaseSpacing(moddist$s1, detailedPlots = TRUE)