Calculate and segment scores for footprints and add them to a SummarizedExeriment
Source:R/footprintScoring.R
footprintScoring.RdGiven a read-level footprinting data and a weight vector defining a specific footprint, calculate footprinting scores, identify high-scoring segments and add them to the input SummarizedExeriment object.
Typicallly, this can be done using addFootprints which will:
Calculate footprint scores for each individual read using
calcFootprintScores, given aSummarizedExperimentwith a read-level assay and a vector of weights that defines the footprint (seewgtparameter).Segment footprint scores to identify high-scoring segments in the scores calculated at step 1 using
segmentFootprintScores.Store high-scoring segments in the
SummarizedExperimentas a column incolDataof the object.
If required, the functions calcFootprintScores or
segmentFootprintScores can also be called directly to perform only
one of the steps above.
The footprint is defined by a weight vector wgt which describes its
length in bases and the shape of the expected modification profile. The score
is based on a cross-correlation of the modification probabilities (centered
by subtracting 0.5) with wgt, weighted by the minimum of
minweight and the modification probability.
Usage
addFootprints(
  se,
  wgt,
  assayName = "mod_prob",
  minconf = 0.7,
  minweight = 0.05,
  minperiod = 50,
  maxperiod = 300,
  thresh = 0.15,
  lenRange = c(10, 80),
  width = 140,
  name = "footprints",
  verbose = TRUE
)

calcFootprintScores(
  se,
  wgt,
  assayName = "mod_prob",
  minconf = 0.7,
  minweight = 0.05,
  verbose = TRUE
)

segmentFootprintScores(
  scoresList,
  minperiod = 50,
  maxperiod = 300,
  thresh = 0.15,
  lenRange = c(10, 80),
  width = 140,
  verbose = TRUE
)
Arguments
- se
A
SummarizedExperimentobject.- wgt
Numeric vector with weights that define the footprint to score. Typically centered at zero.
- assayName
A character scalar providing the name of a read-level assay in
sethat contains modification probabilities.- minconf
Numeric scalar giving the minimal confidence of a base to be included in the calculation of footprint scores.
- minweight
Numeric scalar giving the minimal weight for position in the calculation of footprint scores.
- minperiod, maxperiod
Numeric scalars that define the band-pass filter parameters used to smooth the footprint scores for segmentation.
minperiodandmaxperiodgive the minimal and maximal periods (in base pairs) for the critical frequencies in the score signal that should be retained. The default values are suitable to retain nucleosomal signals. The filtering is performed usingfiltfiltand thus requires thesignalpackage to be installed.- thresh
A numeric scalar giving the minimal smoothed score of a footprint. Higher values make the footprint detection more stringent.
- lenRange
A numeric vector with two elements giving the minimal and maximal number of consecutive score values (base pairs) that must be greater than
threshfor a region to be included in the returned footprints.- width
A numeric scalar giving the width of returned footprints. Footprints are created by placing a region of length
widthcentered on the maximal smoothed score value in each identified high-scoring segment.- name
Character scalar giving the column name in
colData(se)in which the high-scoring footprints are stored as a list (over samples) orIRangesLists (over reads).- verbose
If
TRUE, report on progress.- scoresList
A
listofdata.frames with footprint scores as returned bycalcFootprintScores.
Value
- For
addFootprints , a
SummarizedExperimentobject with footprints incolData(se)[[name]].- For
calcFootprintScores , a
listwith one entry per sample (column) inse. The list elements aredata.frames with columns,readId,pos,pmodandscore, in (continuous) base space frommin(pos(rowRanges(se)))tomax(pos(rowRanges(se)))(only including positions covered by reads in a given sample).- For segmentFootprintScores
, a
list(over samples) ofIRangesListelements (over reads). Each element contains oneIRangesobject with the identified footprints of a single read (all of lengthwithbases).
Examples
# load example data
modbamfile <- system.file("extdata", "6mA_1_10reads.bam",
package = "footprintR")
se <- readModBam(bamfiles = modbamfile, regions = "chr1:6935400-6936300",
modbase = "a", verbose = FALSE,
BPPARAM = BiocParallel::SerialParam())
# add nucleosome footprints
# "wgt": footprint weights for nucleosome with flanks
# - weights are centered around zero (starting with -0.5 and 0.5)
# - weights are adjusted for their relative frequency, to give similar
# importance to flanks and protected region
# - weights are repeated for bases in the (un)modified parts (15 bases in
# flanks and 140 bases protected by the nucleosome)
wgt <- rep(c(0.5, -0.5, 0.5) * c(140/170, 30/170, 140/170), c(15, 140, 15))
se <- addFootprints(se, wgt, thresh = 0.03, name = "nucl")
#> ℹ calculating footprint scores
#> ✔ calculating footprint scores [127ms]
#>
#> ⠙ 0.000 Mio. genomic positions processed (0.001 Mio./s) [2ms]
#> ℹ segmenting footprint scores
#> ✔ segmenting footprint scores [1s]
#>
#> ⠙ 0.000 Mio. genomic positions processed (0.001 Mio./s) [2ms]
se$nucl
#> $s1
#> IRangesList object of length 10:
#> $`s1-233e48a7-f379-4dcf-9270-958231125563`
#> IRanges object with 50 ranges and 0 metadata columns:
#> start end width
#> <integer> <integer> <integer>
#> [1] 6926191 6926330 140
#> [2] 6926371 6926510 140
#> [3] 6926557 6926696 140
#> [4] 6926737 6926876 140
#> [5] 6926917 6927056 140
#> ... ... ... ...
#> [46] 6939327 6939466 140
#> [47] 6939923 6940062 140
#> [48] 6940089 6940228 140
#> [49] 6940249 6940388 140
#> [50] 6940416 6940555 140
#>
#> ...
#> <9 more elements>
#>
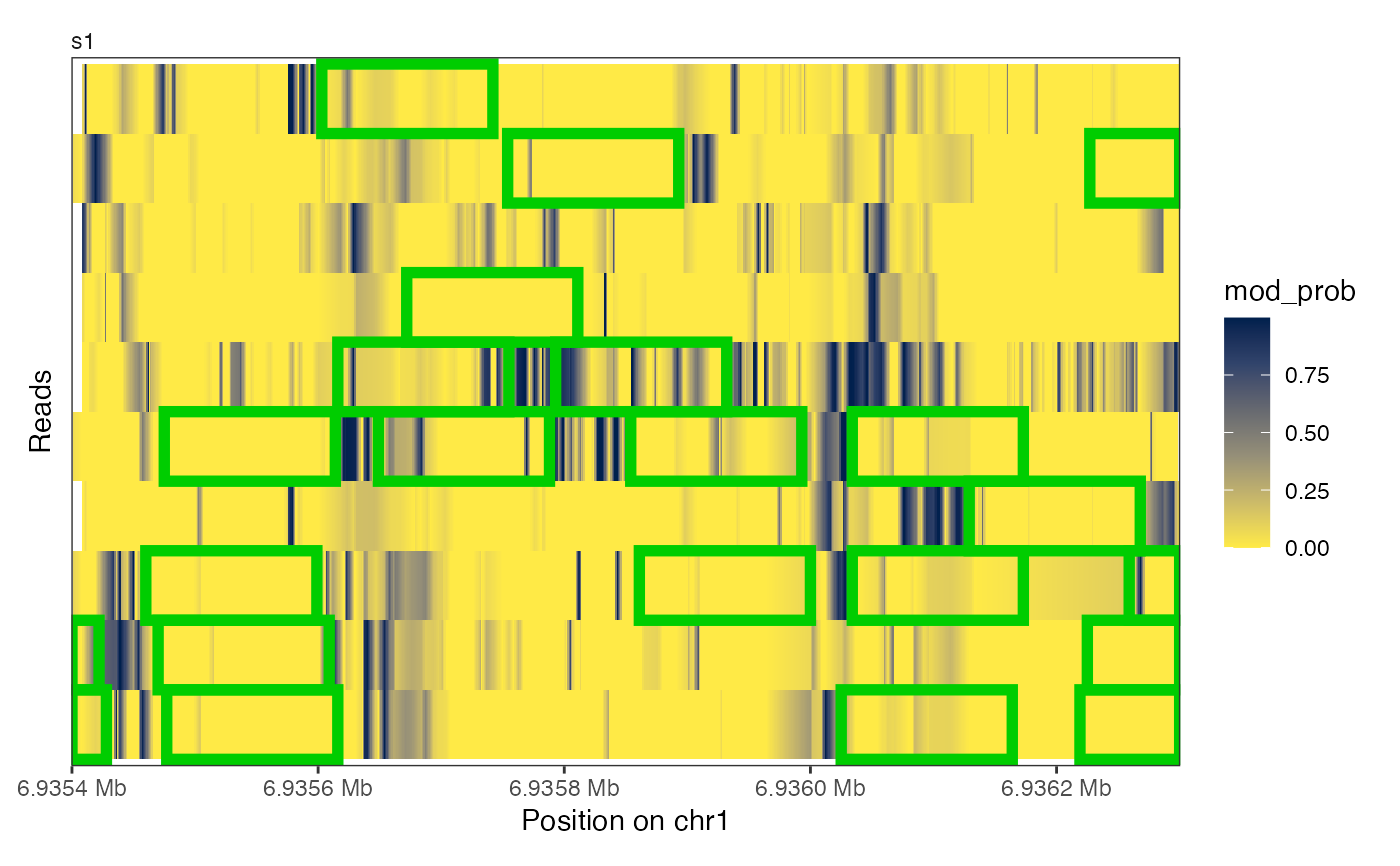
# plot identified footprints
# ... in the heatmap
plotRegion(se, region = "chr1:6935400-6936300",
tracks = list(list(trackType = "Heatmap", trackData = "mod_prob",
interpolate = TRUE, footprintColumns = "nucl",
arglistFootprints = list(color = "green3",
linewidth = 2))))
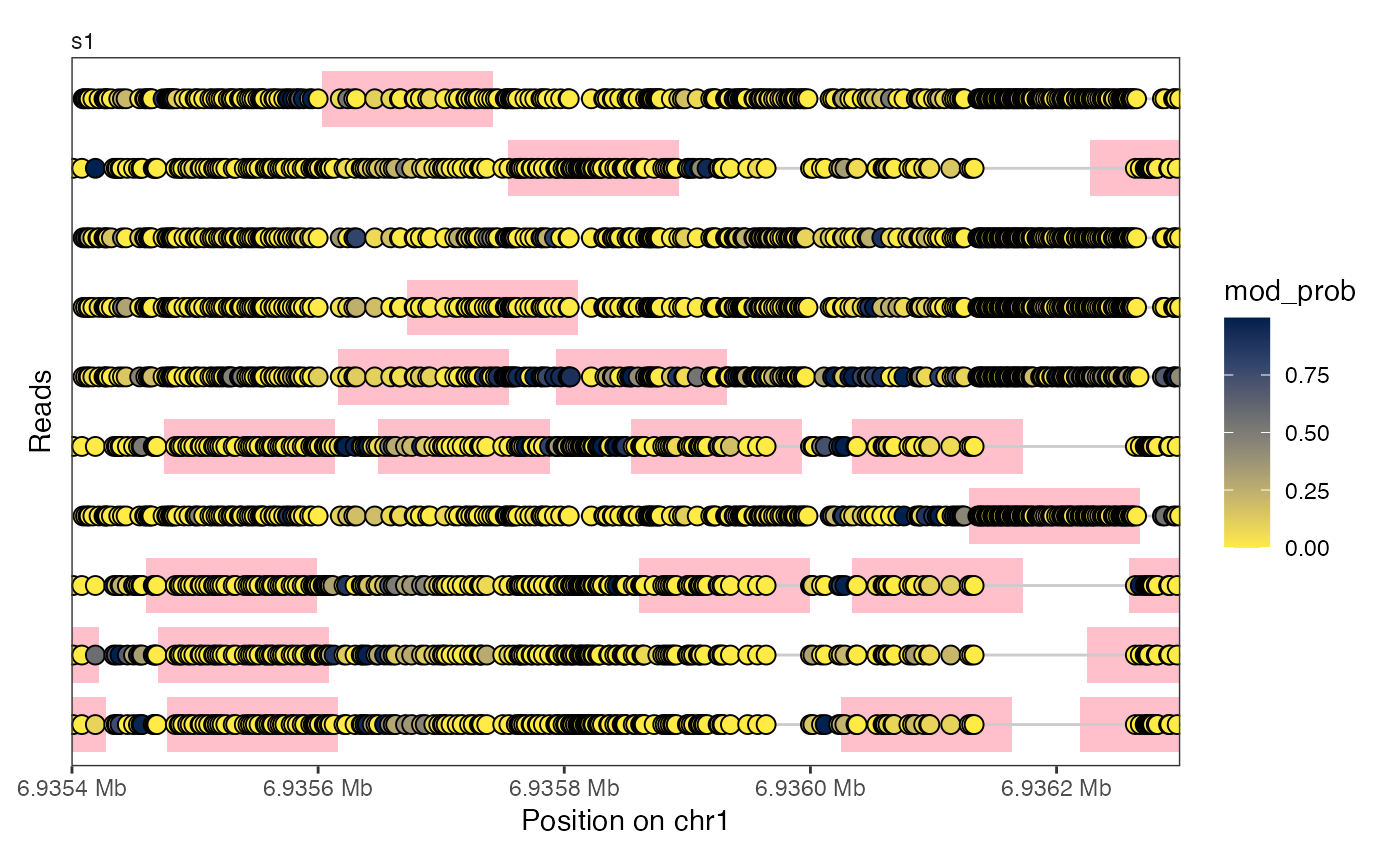
 # ... in the lollipop plot
plotRegion(se, region = "chr1:6935400-6936300",
tracks = list(list(trackType = "Lollipop", trackData = "mod_prob",
footprintColumns = "nucl",
arglistFootprints = list(fill = "pink",
height = 0.8))))
# ... in the lollipop plot
plotRegion(se, region = "chr1:6935400-6936300",
tracks = list(list(trackType = "Lollipop", trackData = "mod_prob",
footprintColumns = "nucl",
arglistFootprints = list(fill = "pink",
height = 0.8))))
 # only calculate score
scoresList <- calcFootprintScores(se, wgt)
#> ℹ calculating footprint scores
#> ✔ calculating footprint scores [74ms]
#>
#> ⠙ 0.000 Mio. genomic positions processed (0.001 Mio./s) [2ms]
lapply(scoresList, nrow)
#> $s1
#> [1] 98955
#>
lapply(scoresList, head)
#> $s1
#> readId pos pmod score
#> 1 s1-233e48a7-f379-4dcf-9270-958231125563 6925830 -0.5 NA
#> 2 s1-233e48a7-f379-4dcf-9270-958231125563 6925831 NA NA
#> 3 s1-233e48a7-f379-4dcf-9270-958231125563 6925832 NA NA
#> 4 s1-233e48a7-f379-4dcf-9270-958231125563 6925833 NA NA
#> 5 s1-233e48a7-f379-4dcf-9270-958231125563 6925834 -0.5 NA
#> 6 s1-233e48a7-f379-4dcf-9270-958231125563 6925835 NA NA
#>
# segment calculated scores
irl <- segmentFootprintScores(scoresList, thresh = 0.05)
#> ℹ segmenting footprint scores
#> ✔ segmenting footprint scores [100ms]
#>
#> ⠙ 0.000 Mio. genomic positions processed (0.001 Mio./s) [2ms]
irl$s1
#> IRangesList object of length 10:
#> $`s1-233e48a7-f379-4dcf-9270-958231125563`
#> IRanges object with 15 ranges and 0 metadata columns:
#> start end width
#> <integer> <integer> <integer>
#> [1] 6926371 6926510 140
#> [2] 6926557 6926696 140
#> [3] 6926737 6926876 140
#> [4] 6926917 6927056 140
#> [5] 6927105 6927244 140
#> ... ... ... ...
#> [11] 6935854 6935993 140
#> [12] 6936034 6936173 140
#> [13] 6938096 6938235 140
#> [14] 6939136 6939275 140
#> [15] 6940416 6940555 140
#>
#> $`s1-d52a5f6a-a60a-4f85-913e-eada84bfbfb9`
#> IRanges object with 1 range and 0 metadata columns:
#> start end width
#> <integer> <integer> <integer>
#> [1] 6933059 6933198 140
#>
#> $`s1-fc4646ce-66f9-401f-b968-e9b0cda14d61`
#> IRanges object with 0 ranges and 0 metadata columns:
#> start end width
#> <integer> <integer> <integer>
#>
#> ...
#> <7 more elements>
# only calculate score
scoresList <- calcFootprintScores(se, wgt)
#> ℹ calculating footprint scores
#> ✔ calculating footprint scores [74ms]
#>
#> ⠙ 0.000 Mio. genomic positions processed (0.001 Mio./s) [2ms]
lapply(scoresList, nrow)
#> $s1
#> [1] 98955
#>
lapply(scoresList, head)
#> $s1
#> readId pos pmod score
#> 1 s1-233e48a7-f379-4dcf-9270-958231125563 6925830 -0.5 NA
#> 2 s1-233e48a7-f379-4dcf-9270-958231125563 6925831 NA NA
#> 3 s1-233e48a7-f379-4dcf-9270-958231125563 6925832 NA NA
#> 4 s1-233e48a7-f379-4dcf-9270-958231125563 6925833 NA NA
#> 5 s1-233e48a7-f379-4dcf-9270-958231125563 6925834 -0.5 NA
#> 6 s1-233e48a7-f379-4dcf-9270-958231125563 6925835 NA NA
#>
# segment calculated scores
irl <- segmentFootprintScores(scoresList, thresh = 0.05)
#> ℹ segmenting footprint scores
#> ✔ segmenting footprint scores [100ms]
#>
#> ⠙ 0.000 Mio. genomic positions processed (0.001 Mio./s) [2ms]
irl$s1
#> IRangesList object of length 10:
#> $`s1-233e48a7-f379-4dcf-9270-958231125563`
#> IRanges object with 15 ranges and 0 metadata columns:
#> start end width
#> <integer> <integer> <integer>
#> [1] 6926371 6926510 140
#> [2] 6926557 6926696 140
#> [3] 6926737 6926876 140
#> [4] 6926917 6927056 140
#> [5] 6927105 6927244 140
#> ... ... ... ...
#> [11] 6935854 6935993 140
#> [12] 6936034 6936173 140
#> [13] 6938096 6938235 140
#> [14] 6939136 6939275 140
#> [15] 6940416 6940555 140
#>
#> $`s1-d52a5f6a-a60a-4f85-913e-eada84bfbfb9`
#> IRanges object with 1 range and 0 metadata columns:
#> start end width
#> <integer> <integer> <integer>
#> [1] 6933059 6933198 140
#>
#> $`s1-fc4646ce-66f9-401f-b968-e9b0cda14d61`
#> IRanges object with 0 ranges and 0 metadata columns:
#> start end width
#> <integer> <integer> <integer>
#>
#> ...
#> <7 more elements>