Make volcano plots
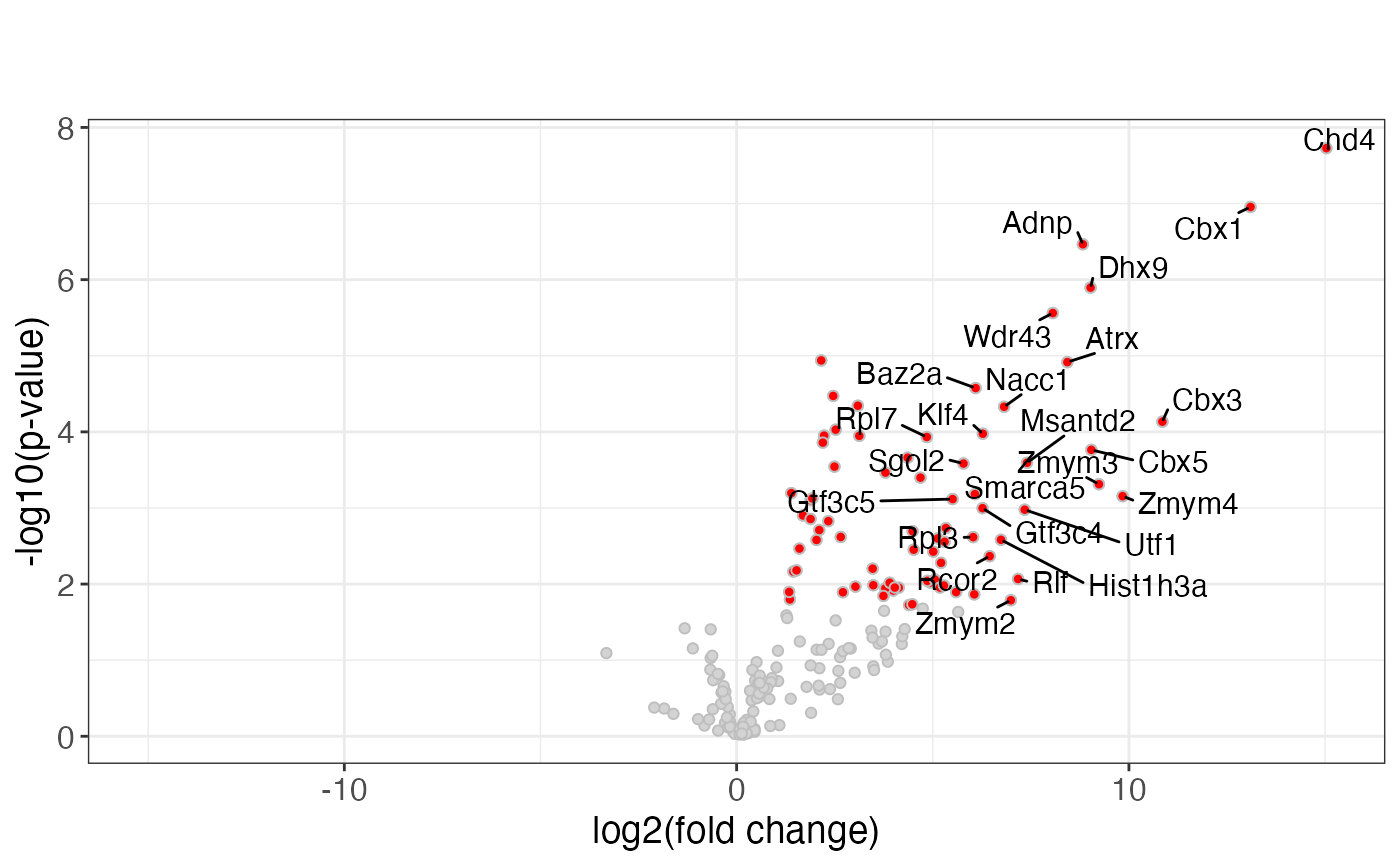
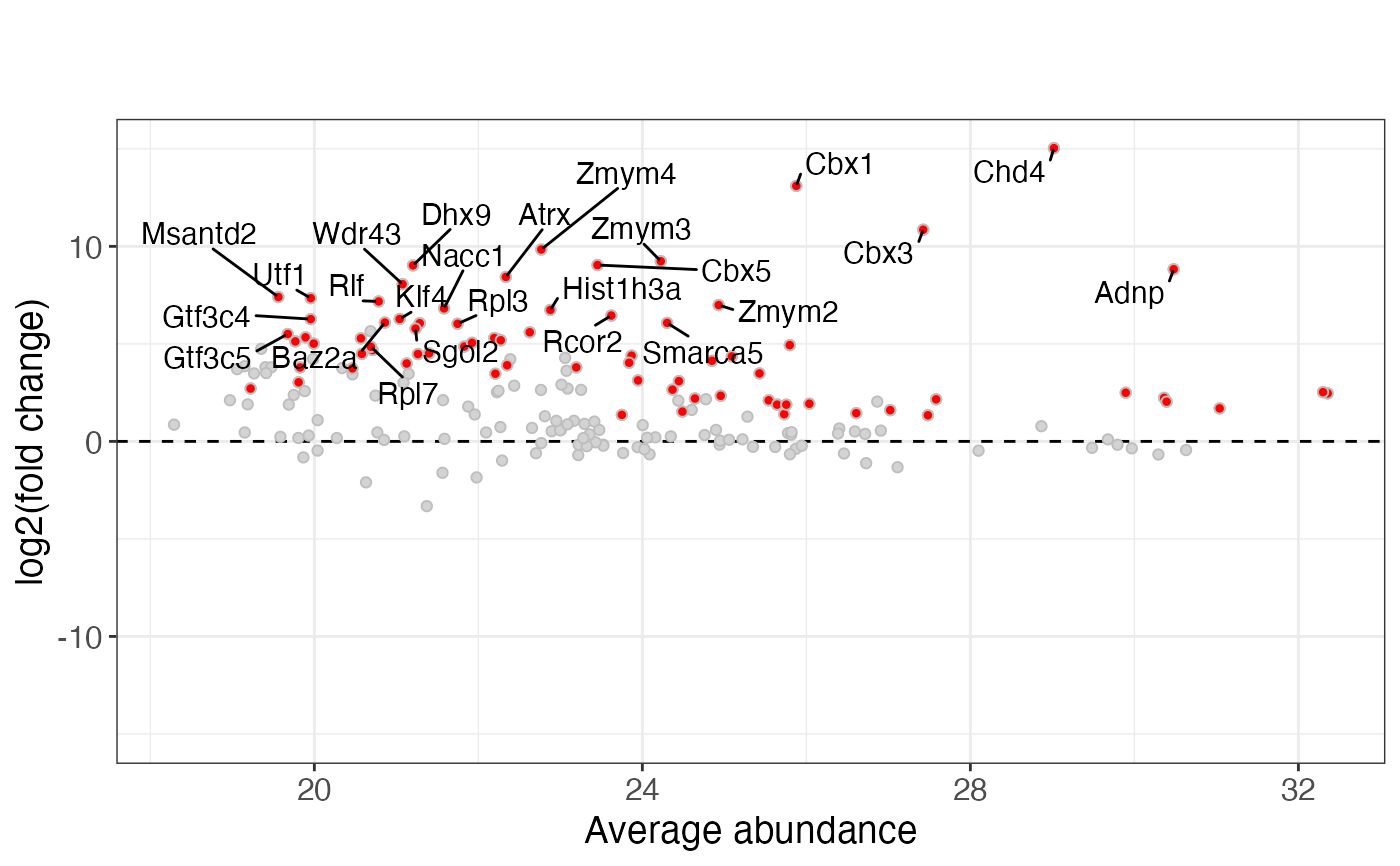
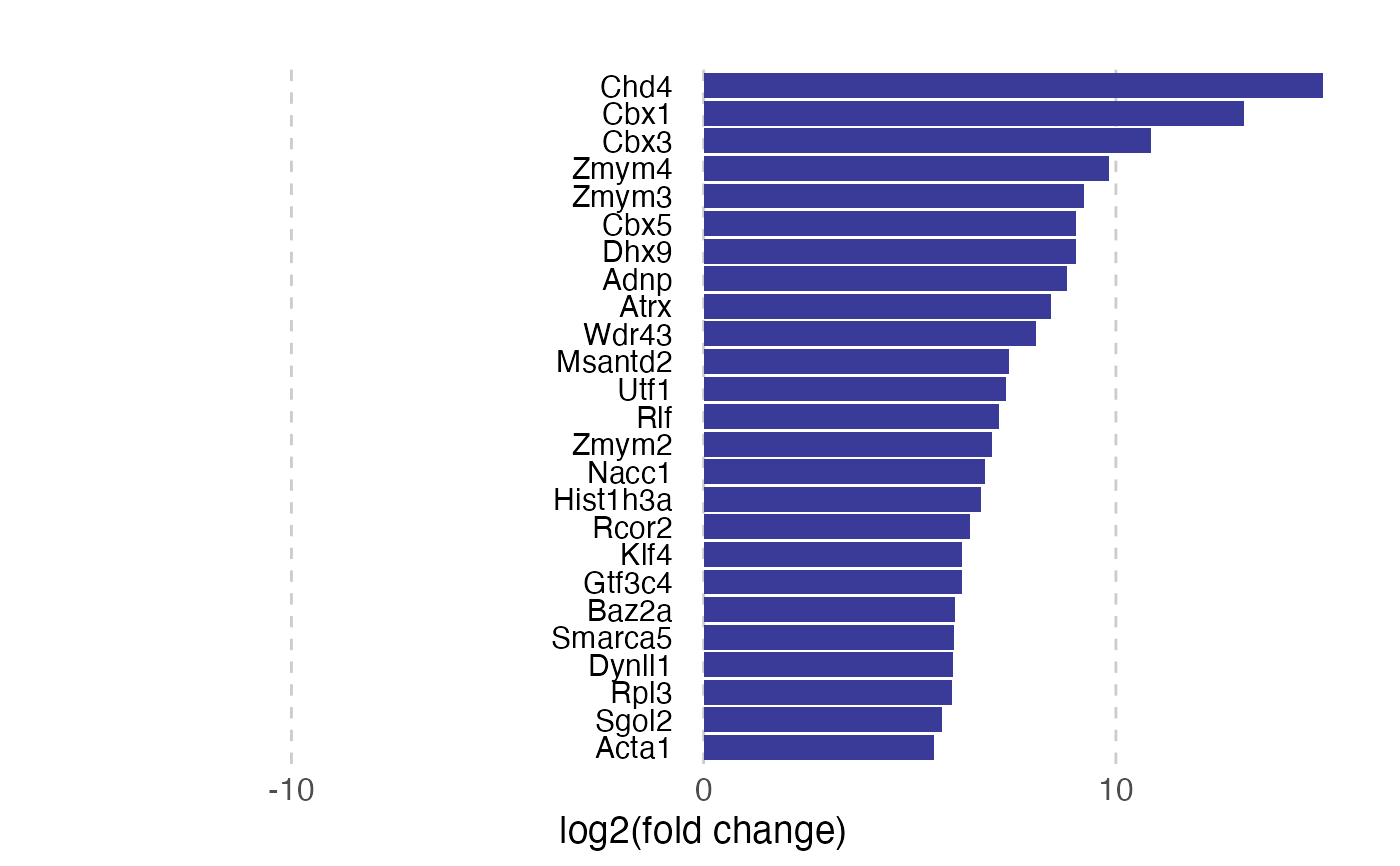
plotVolcano.RdConstruct interactive and non-interactive volcano plots, MA plots, STRING networks of up- and downregulated proteins, bar plots of average abundances and log-fold changes, as well as plots of top-ranked feature collections.
plotVolcano(
  sce,
  res,
  testType,
  xv = NULL,
  yv = NULL,
  xvma = NULL,
  volcind = NULL,
  plotnote = "",
  plottitle = "",
  plotsubtitle = "",
  volcanoFeaturesToLabel = c(""),
  volcanoMaxFeatures = 25,
  volcanoLabelSign = "both",
  baseFileName = NULL,
  comparisonString,
  groupComposition = NULL,
  stringDb = NULL,
  featureCollections = list(),
  complexFDRThr = 0.1,
  maxNbrComplexesToPlot = 10,
  maxComplexSimilarity = 1,
  curveparam = list(),
  abundanceColPat = "",
  xlab = "log2(fold change)",
  ylab = "-log10(p-value)",
  xlabma = "Average abundance",
  labelOnlySignificant = TRUE,
  interactiveDisplayColumns = NULL,
  interactiveGroupColumn = NULL,
  makeInteractiveVolcano = TRUE,
  maxTextWidthBarplot = NULL
)
Arguments
- sce
A
SummarizedExperimentobject (or a derivative). Can beNULLif no "complex bar plots" are made (i.e., iffeatureCollectionshas no entry named "complexes", or ifbaseFileNameisNULL).- res
A
data.frameobject with test results (typically generated byrunTest).- testType
Character scalar indicating the type of test that was run, either
"ttest","limma"or"proDA".- xv, yv
Character scalars indicating which columns of
resthat should be used as the x- and y-axis of the volcano plot, respectively. IfNULL, will be determined based ontestType.- xvma
If not
NULL, a character scalar indicating which column ofresshould be used as the x-axis for an MA plot. The y-axis column will bexv. IfNULL, no MA plot is generated.- volcind
Character scalar indicating which column in
resthat represents the "significance" column. This should be a logical column; rows with a value equal toTRUEwill be colored in the plot. IfNULL, will be determined based ontestType.- plotnote
Character scalar with a note to add to the plot.
- plottitle
Character scalar giving the title of the plot.
- plotsubtitle
Character scalar giving the subtitle of the plot.
- volcanoFeaturesToLabel
Character vector, features to label in the plot.
- volcanoMaxFeatures
Numeric scalar, the maximum number of features to color in the plot.
- volcanoLabelSign
Character scalar, either
"both","pos", or"neg", indicating whether to label the most significant features regardless of sign, or only those with positive/negative log-fold changes.- baseFileName
Character scalar or
NULL, the base file name of the output files. IfNULL, no result files are generated.- comparisonString
Character scalar giving the name of the comparison of interest. This is used to extract the appropriate column from the metadata of the feature collections to make the gene set plots.
- groupComposition
A list providing the composition of each group used in the comparisons indicated by
comparisonString. IfNULL, assumes that each group used incomparisonStringconsists of a single group in thegroupcolumn ofcolData(sce).- stringDb
A STRINGdb object or
NULL. If notNULL, STRING network plots of up- and downregulated genes will be added to the output pdf file.- featureCollections
A list of
CharacterLists with feature collections. If there is a collection named"complexes", volcano plots and barplots for significant complexes are included in the output pdf files.- complexFDRThr
Numeric scalar giving the FDR threshold for complexes to be considered significant.
- maxNbrComplexesToPlot
Numeric scalar, the largest number of significant complexes to generate separate volcano plots for.
- maxComplexSimilarity
Numeric scalar. If a significant complex C has a Jaccard similarity exceeding this value with a complex for which a volcano plot has already been generated, no volcano plot will be generated for C. The default value is 1, which means that no complex will be excluded.
- curveparam
List with curve parameters for creating the Perseus-like significance curves in the volcano plots.
- abundanceColPat
Character vector providing the column patterns used to identify abundance columns in the result table, to make bar plots for significant complexes. Typically the name of an assay.
- xlab, ylab, xlabma
Character scalars giving the x- and y-axis labels to use for the volcano plots, and the x-axis label to use for the MA plot.
- labelOnlySignificant
Logical scalar, whether to label only significant features (where
volcindisTRUE), or to select the topvolcanoMaxFeaturesregardless of significance status.- interactiveDisplayColumns
Character vector (or
NULL) indicating which columns ofresto include in the tooltip for the interactive volcano plots. The default shows the feature ID.- interactiveGroupColumn
Character scalar (or
NULL, default) indicating the column to group points by in the interactive volcano plot. Hovering over a point will highlight all other points with the same value of this column.- makeInteractiveVolcano
Logical scalar, indicating whether to construct an interactive volcano plot in addition to the static one.
- maxTextWidthBarplot
Numeric scalar giving the maximum allowed width for text labels in the bar plot of log-fold changes. If not
NULL, the size of the labels will be scaled down in an attempt to keep the labels inside the canvas. Typically set to half the width of the plot device (in inches).
Value
A list with plot objects.
If baseFileName is not NULL, pdf files with volcano
plots and bar plots for significant complexes will also be generated.
Examples
sce <- readRDS(system.file("extdata", "mq_example", "1356_sce.rds",
                           package = "einprot"))
tres <- runTest(sce, comparisons = list(c("RBC_ctrl", "Adnp")),
                testType = "limma", assayForTests = "log2_LFQ.intensity",
                assayImputation = "imputed_LFQ.intensity")
pv <- plotVolcano(sce, tres$tests$Adnp_vs_RBC_ctrl, testType = "limma",
                  comparisonString = "Adnp_vs_RBC_ctrl")
#> Warning: Removed 39 rows containing missing values or values outside the scale range
#> (`geom_interactive_point()`).
pv$gg
#> Warning: Removed 39 rows containing missing values or values outside the scale range
#> (`geom_point()`).

pv$ggma
#> Warning: Removed 39 rows containing missing values or values outside the scale range
#> (`geom_point()`).

pv$ggwf
