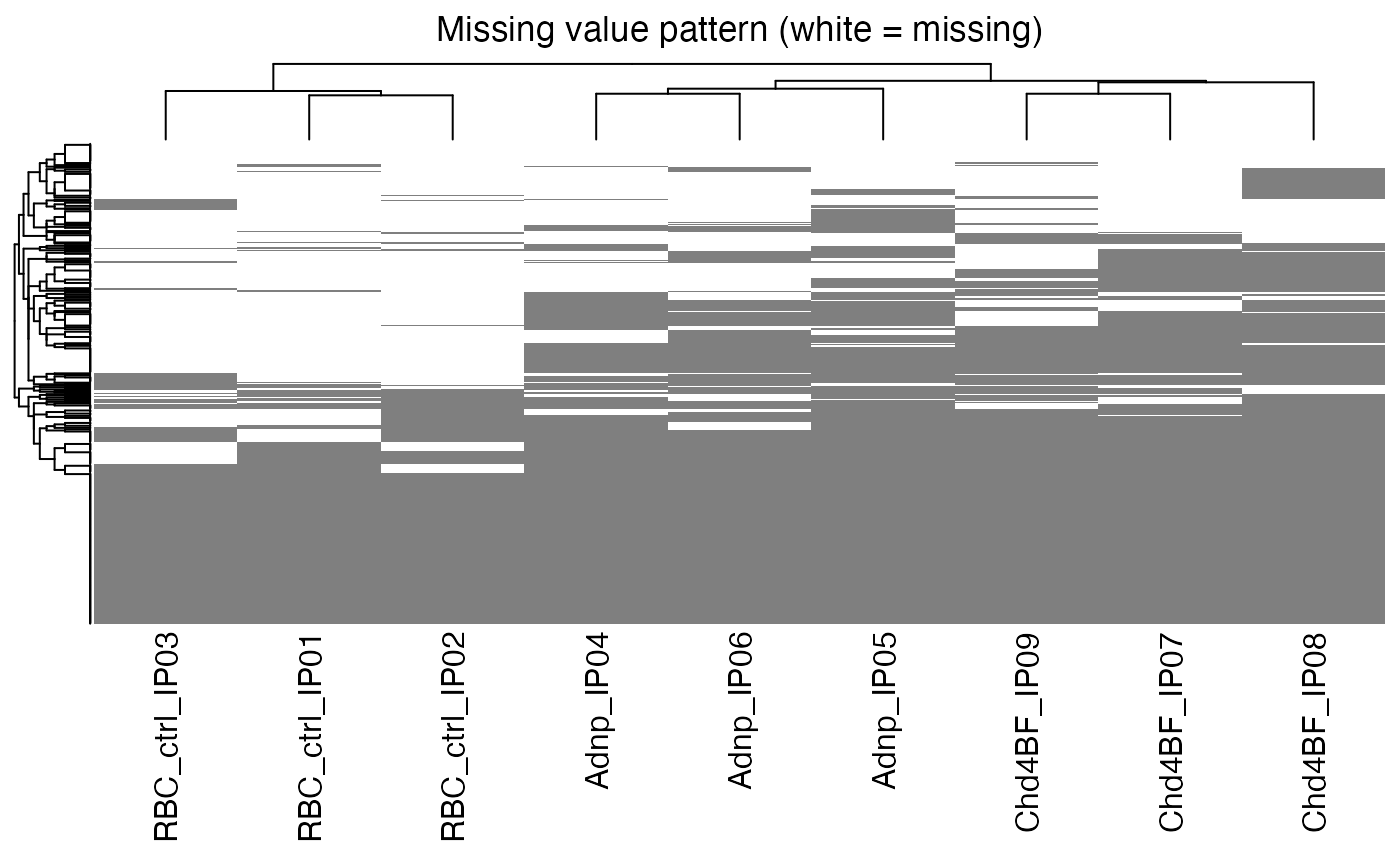
Plot heatmap of missing values
plotMissingValuesHeatmap.RdCreate a heatmap of the data matrix, indicating which values are missing and observed, respectively.
plotMissingValuesHeatmap(
  sce,
  assayMissing,
  onlyRowsWithMissing = FALSE,
  settings = "clustered",
  ...
)
Arguments
- sce
A
SummarizedExperimentobject.- assayMissing
Character scalar indicating the name of a logical assay of
scerepresenting the missingness pattern.FALSEentries should represent observed values, whileTRUEentries represent missing values.- onlyRowsWithMissing
Logical scalar indicating whether to only include rows with at least one missing (
TRUE) value.- settings
Character scalar or
NULL. Setting this to"clustered"creates a heatmap with rows and columns clustered (used in theeinprotreport). Setting it toNULLallows any argument to be passed toComplexHeatmap::Heatmapvia the...argument.- ...
Additional arguments passed to
ComplexHeatmap::Heatmap.
Value
A ComplexHeatmap object.
Examples
sce <- importExperiment(system.file("extdata", "mq_example",
                                    "1356_proteinGroups.txt",
                                    package = "einprot"),
                        iColPattern = "^iBAQ\\.")$sce
SummarizedExperiment::assay(sce, "iBAQ")[
    SummarizedExperiment::assay(sce, "iBAQ") == 0] <- NA
SummarizedExperiment::assay(sce, "missing") <-
    is.na(SummarizedExperiment::assay(sce, "iBAQ"))
plotMissingValuesHeatmap(sce, "missing")