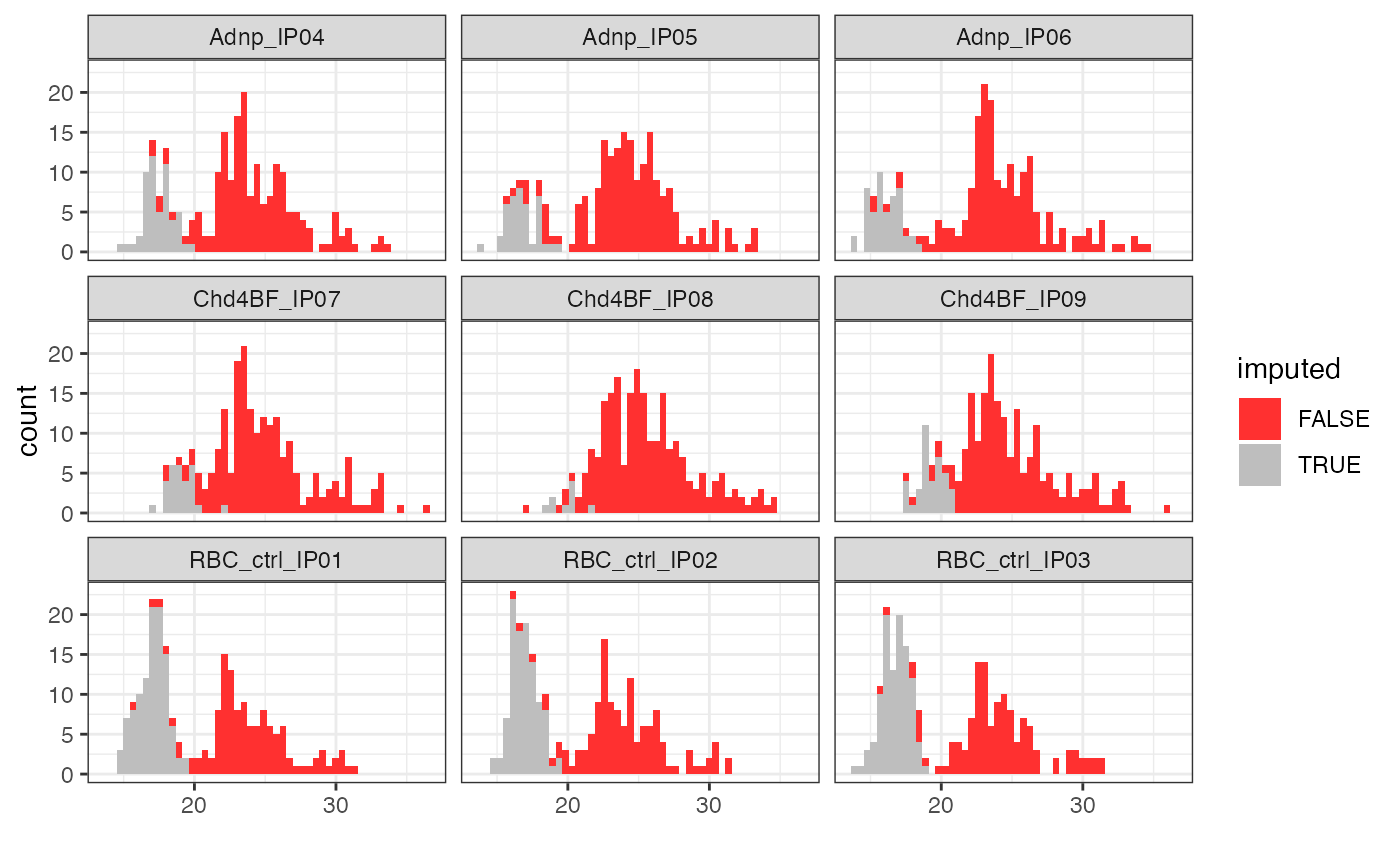
Plot distribution of imputed and unimputed values
plotImputationDistribution.RdCreate a plot showing the distribution of both imputed and observed
abundance values contained in a SummarizedExperiment object.
plotImputationDistribution(
  sce,
  assayToPlot,
  assayImputation,
  xlab = "",
  plotType = "histogram"
)
Arguments
- sce
A
SummarizedExperimentobject (or a derivative).- assayToPlot
Character scalar indicating the name of a numeric assay of
sceto use for plotting.- assayImputation
Character scalar indicating the name of a logical assay of
sceto use for filling the distribution plots.- xlab
Character scalar providing the x-axis label for the plot.
- plotType
Character scalar indicating the type of plot to make (either "histogram" or "density").
Value
A ggplot object.
Examples
sce <- readRDS(system.file("extdata", "mq_example", "1356_sce.rds",
                           package = "einprot"))
plotImputationDistribution(sce, assayToPlot = "log2_LFQ.intensity",
                           assayImputation = "imputed_LFQ.intensity")
