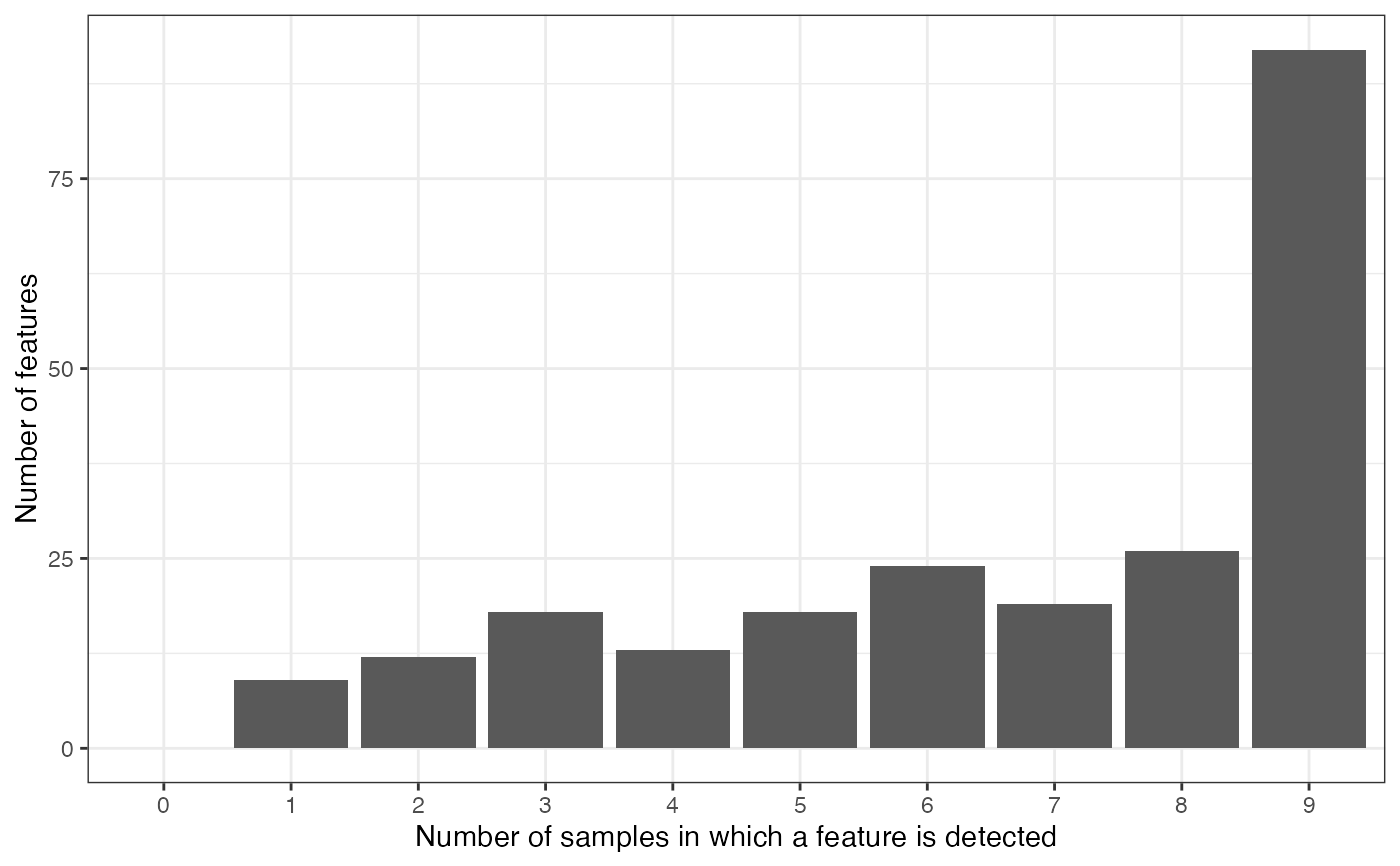
Plot feature detection rate
plotDetectedInSamples.RdPlot the distribution of the number of samples where features are detected.
plotDetectedInSamples(dfNA, valueType = NULL)Arguments
- dfNA
A
DFrameordata.framewith at least columns"name","nNA"and"pNA", representing the feature name and the number and fraction of missing values.- valueType
A
characterscalar indicating whether the values in the"pNA"column represent fractions (valueType = "fraction", values in [0, 1]) or percentages (valueType = "percentage", values in [0, 100]). IfNULL, the type will be guessed from the observed values.
Value
A ggplot object.
Examples
sce <- readRDS(system.file("extdata", "mq_example", "1356_sce.rds",
                           package = "einprot"))
plotDetectedInSamples(SummarizedExperiment::rowData(sce),
                      valueType = "percentage")