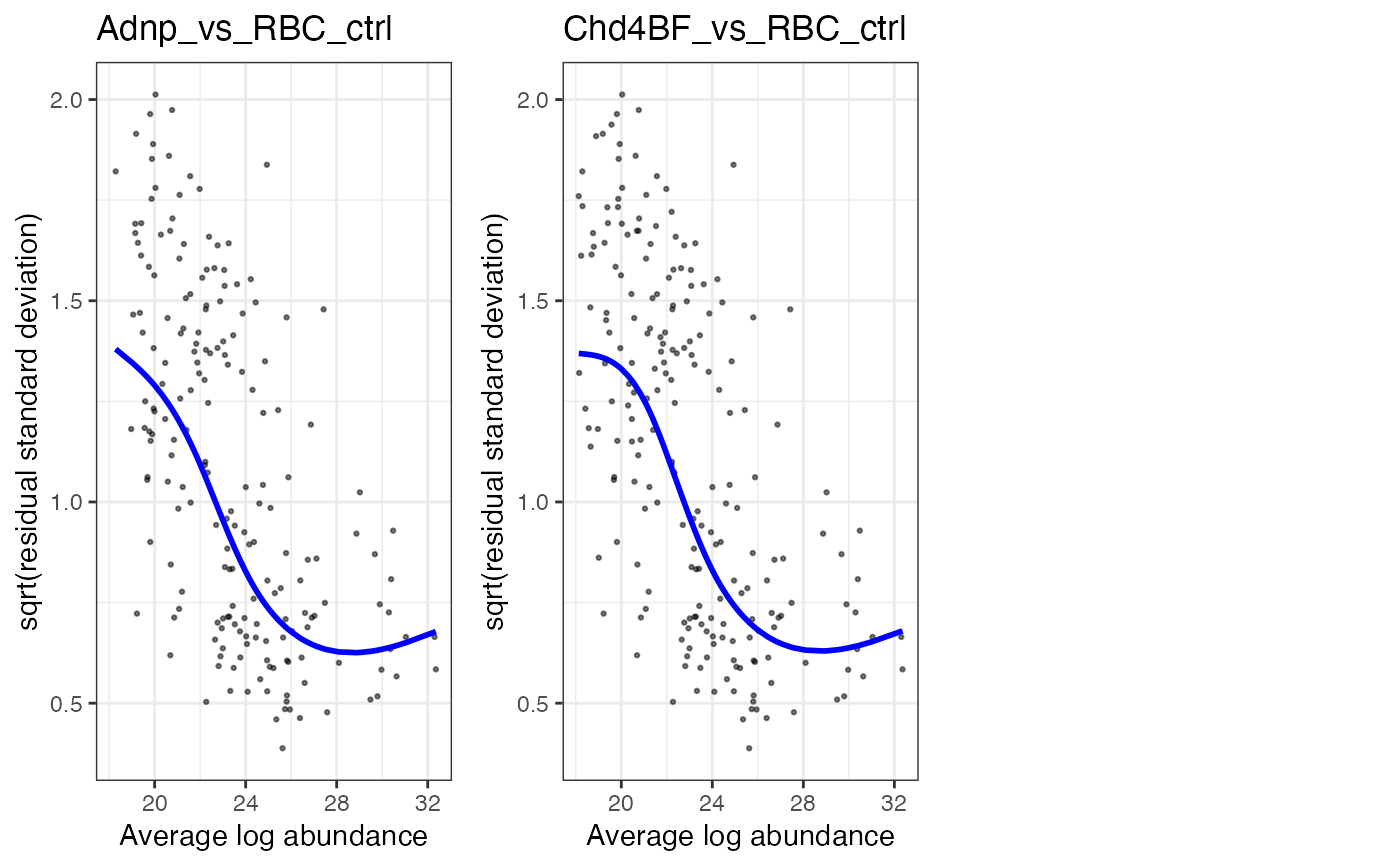
Construct SA plot from limma results
makeSAPlot.RdGiven a list of data.frames with limma test results, create
an SA plot for each contrast.
makeSAPlot(testList)Arguments
- testList
List of test results, typically generated using
runTest().
Value
A cowplot object
Examples
sce <- readRDS(system.file("extdata", "mq_example", "1356_sce.rds",
                           package = "einprot"))
tres <- runTest(sce, comparisons = list(c("RBC_ctrl", "Adnp"),
                                        c("RBC_ctrl", "Chd4BF")),
                testType = "limma", assayForTests = "log2_LFQ.intensity",
                assayImputation = "imputed_LFQ.intensity")
makeSAPlot(tres$tests)
#> Warning: Removed 39 rows containing missing values or values outside the scale range
#> (`geom_point()`).
#> Warning: Removed 39 rows containing missing values or values outside the scale range
#> (`geom_line()`).
#> Warning: Removed 20 rows containing missing values or values outside the scale range
#> (`geom_point()`).
#> Warning: Removed 20 rows containing missing values or values outside the scale range
#> (`geom_line()`).
