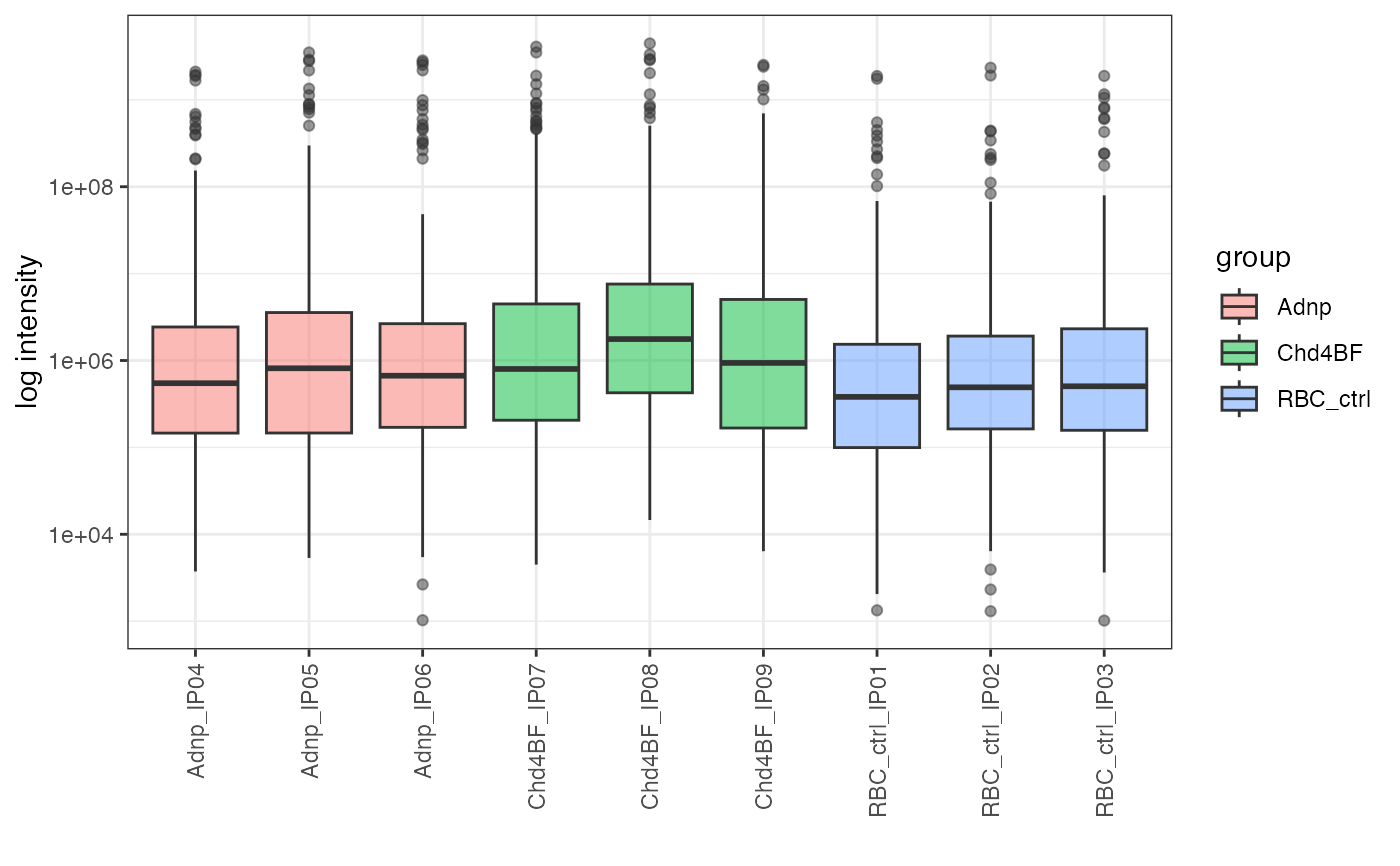
Make intensity boxplot
makeIntensityBoxplots.RdGenerate boxplots of the intensity distributions for the samples in a
SummarizedExperiment object.
makeIntensityBoxplots(sce, assayName, doLog, ylab, maxNGroups = 25)Arguments
- sce
A
SummarizedExperimentobject (or a derivative). ThecolDatamust have columns named"sample"and"group", for grouping and coloring the values, respectively.- assayName
Character scalar, the name of the assay of
sceto use for the plots.- doLog
Logical scalar, whether to log-transform the y-axis.
- ylab
Character scalar, the label to use for the y-axis.
- maxNGroups
Numeric scalar, the maximum number of groups to display in the legend. If there are more than
maxNGroupsgroups, the legend is suppressed.
Value
A ggplot object.
Examples
mqFile <- system.file("extdata", "mq_example", "1356_proteinGroups.txt",
                      package = "einprot")
samples <- c("Adnp_IP04", "Adnp_IP05", "Adnp_IP06",
             "Chd4BF_IP07", "Chd4BF_IP08", "Chd4BF_IP09",
             "RBC_ctrl_IP01", "RBC_ctrl_IP02", "RBC_ctrl_IP03")
out <- importExperiment(inFile = mqFile, iColPattern = "^iBAQ\\.",
                        includeOnlySamples = samples)
sampleAnnot <- data.frame(sample = samples,
                          group = gsub("_IP.*", "", samples))
sce <- addSampleAnnots(out$sce, sampleAnnot = sampleAnnot)
makeIntensityBoxplots(sce, assayName = "iBAQ", doLog = TRUE,
                      ylab = "log intensity")
#> Warning: log-10 transformation introduced infinite values.
#> Warning: Removed 1497 rows containing non-finite outside the scale range
#> (`stat_boxplot()`).