Generate heatmap
makeAbundanceHeatmap.RdGenerate a heatmap from a defined assay.
makeAbundanceHeatmap(sce, assayToPlot, doCenter, settings = "report", ...)Arguments
- sce
A
SummarizedExperimentobject (or a derivative).- assayToPlot
Character scalar giving the name of the assay in
sceto plot.- doCenter
Logical scalar, whether to center the abundance values by row before creating the heatmap.
- settings
Character scalar or
NULL. Setting this to either"report"or"export"creates heatmaps with specific settings used ineinprotreports and when exporting the heatmap to a pdf. Setting it toNULLallows any argument to be passed toComplexHeatmap::Heatmapvia the...argument.- ...
If
settingsisNULL, additional arguments passed toComplexHeatmap::Heatmap.
Value
A ComplexHeatmap object.
Examples
sce <- readRDS(system.file("extdata", "mq_example", "1356_sce.rds",
package = "einprot"))
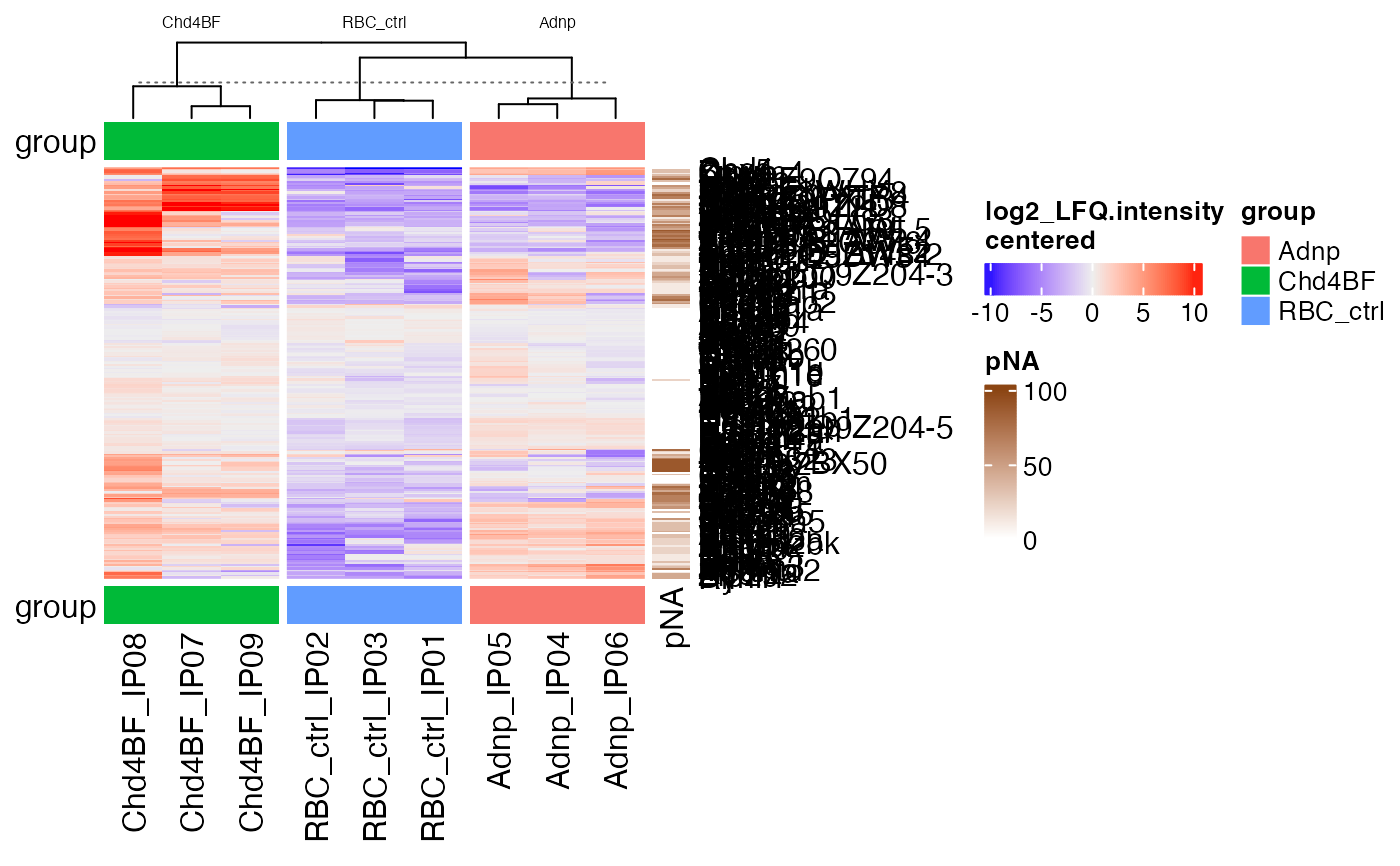
hm <- makeAbundanceHeatmap(sce, assayToPlot = "log2_LFQ.intensity",
doCenter = TRUE, settings = "report")
#> 'magick' package is suggested to install to give better rasterization.
#>
#> Set `ht_opt$message = FALSE` to turn off this message.
ComplexHeatmap::draw(hm)
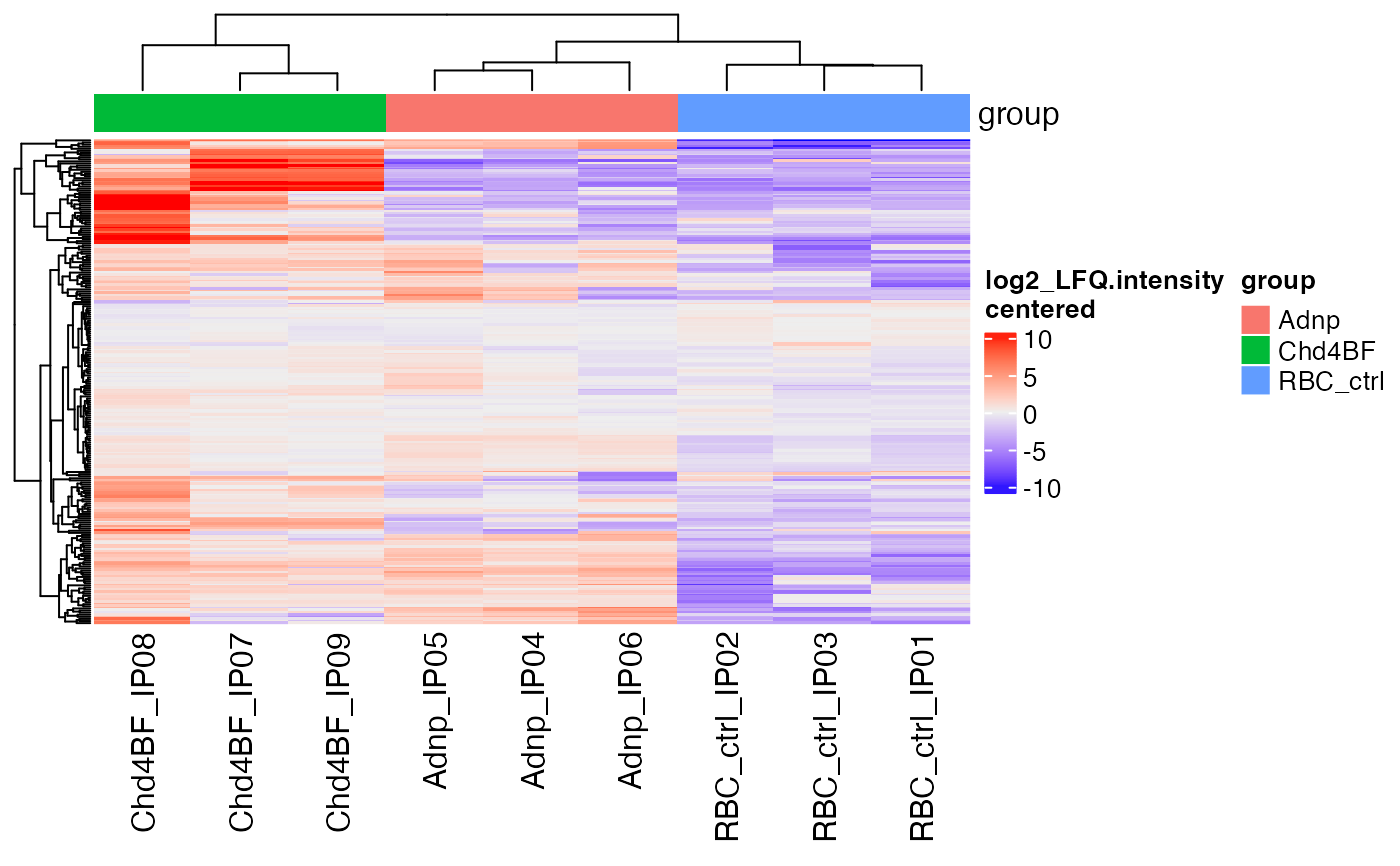 hm <- makeAbundanceHeatmap(sce, assayToPlot = "log2_LFQ.intensity",
doCenter = TRUE, settings = "export")
#> 'magick' package is suggested to install to give better rasterization.
#>
#> Set `ht_opt$message = FALSE` to turn off this message.
ComplexHeatmap::draw(hm)
hm <- makeAbundanceHeatmap(sce, assayToPlot = "log2_LFQ.intensity",
doCenter = TRUE, settings = "export")
#> 'magick' package is suggested to install to give better rasterization.
#>
#> Set `ht_opt$message = FALSE` to turn off this message.
ComplexHeatmap::draw(hm)