Filter features in a SummarizedExperiment object
filterFeaturesSE.RdFilter the features (rows) in a SummarizedExperiment object based on a user-defined combination of filters.
filterFeaturesSE(sce, filtersSE = list(), plotUpset = TRUE, exclFile = NULL)Arguments
- sce
A
SummarizedExperimentobject (or a derivative).- filtersSE
A named
list, where each element is a function that takes aSummarizedExperimentobject as input and returns a logical vector of the same length as the number of rows insce, and whereTRUEimplies that the row should be retained. Default sets of filtering functions for input data from different tools are provided (see?defaultFiltersSE).- plotUpset
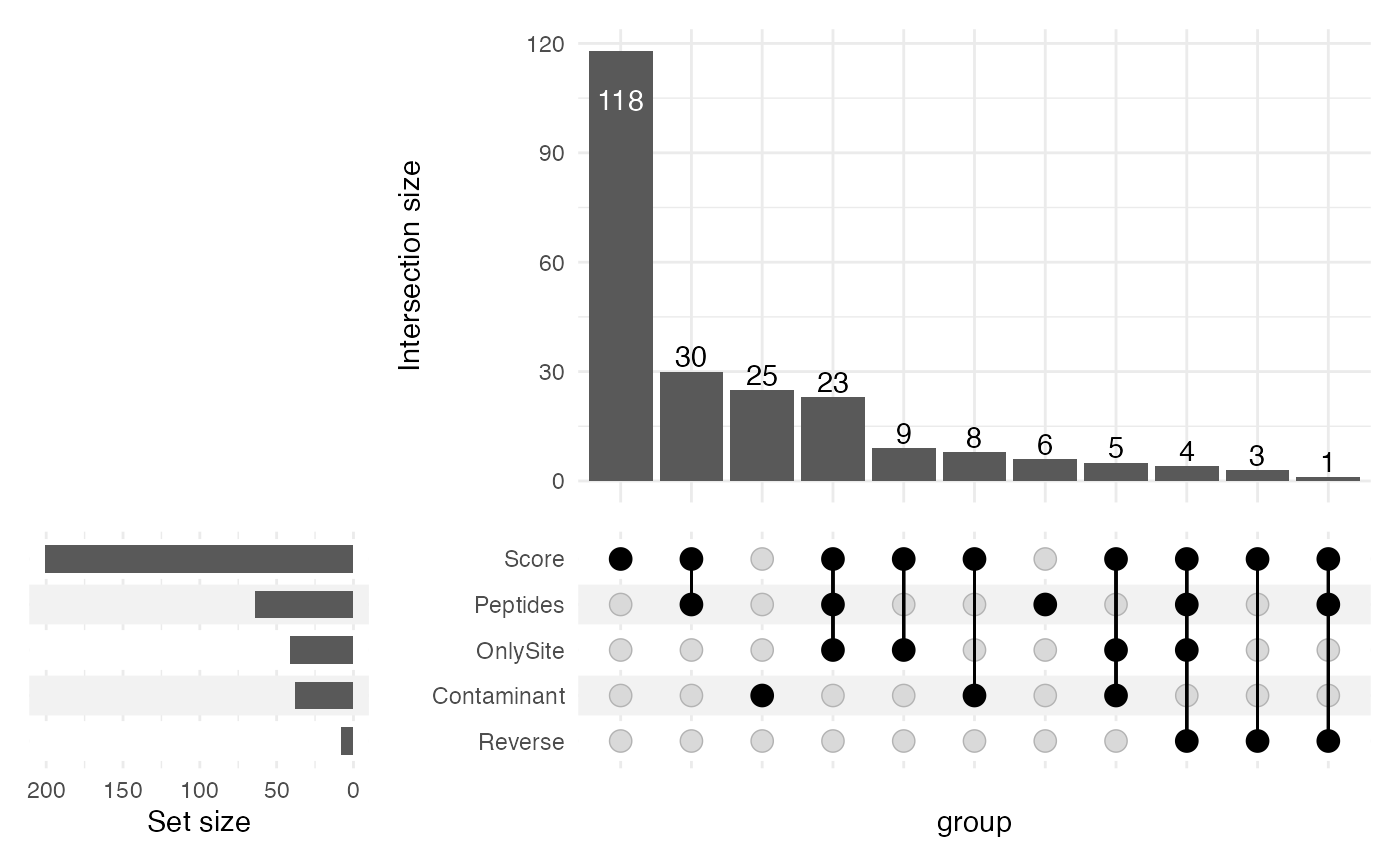
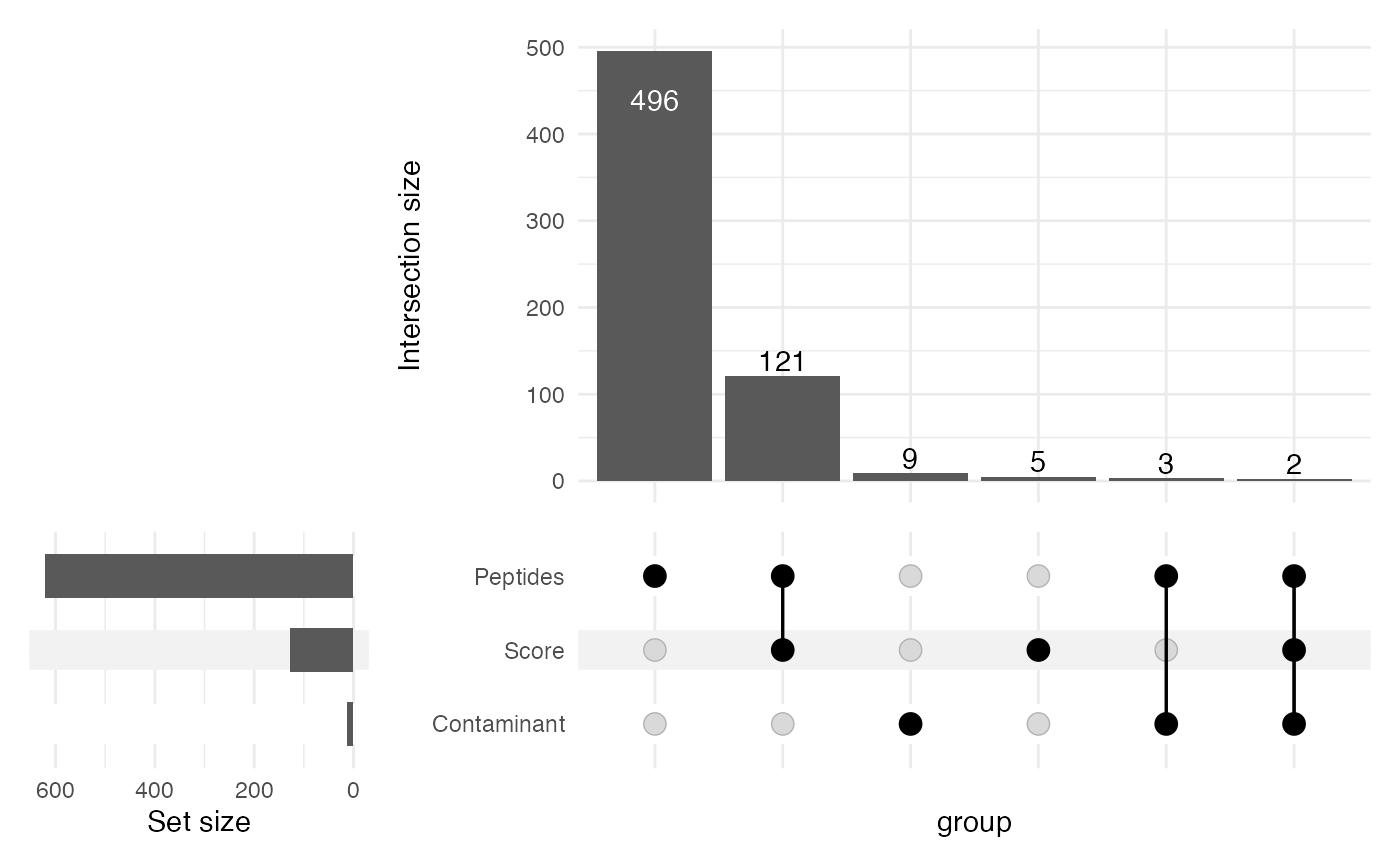
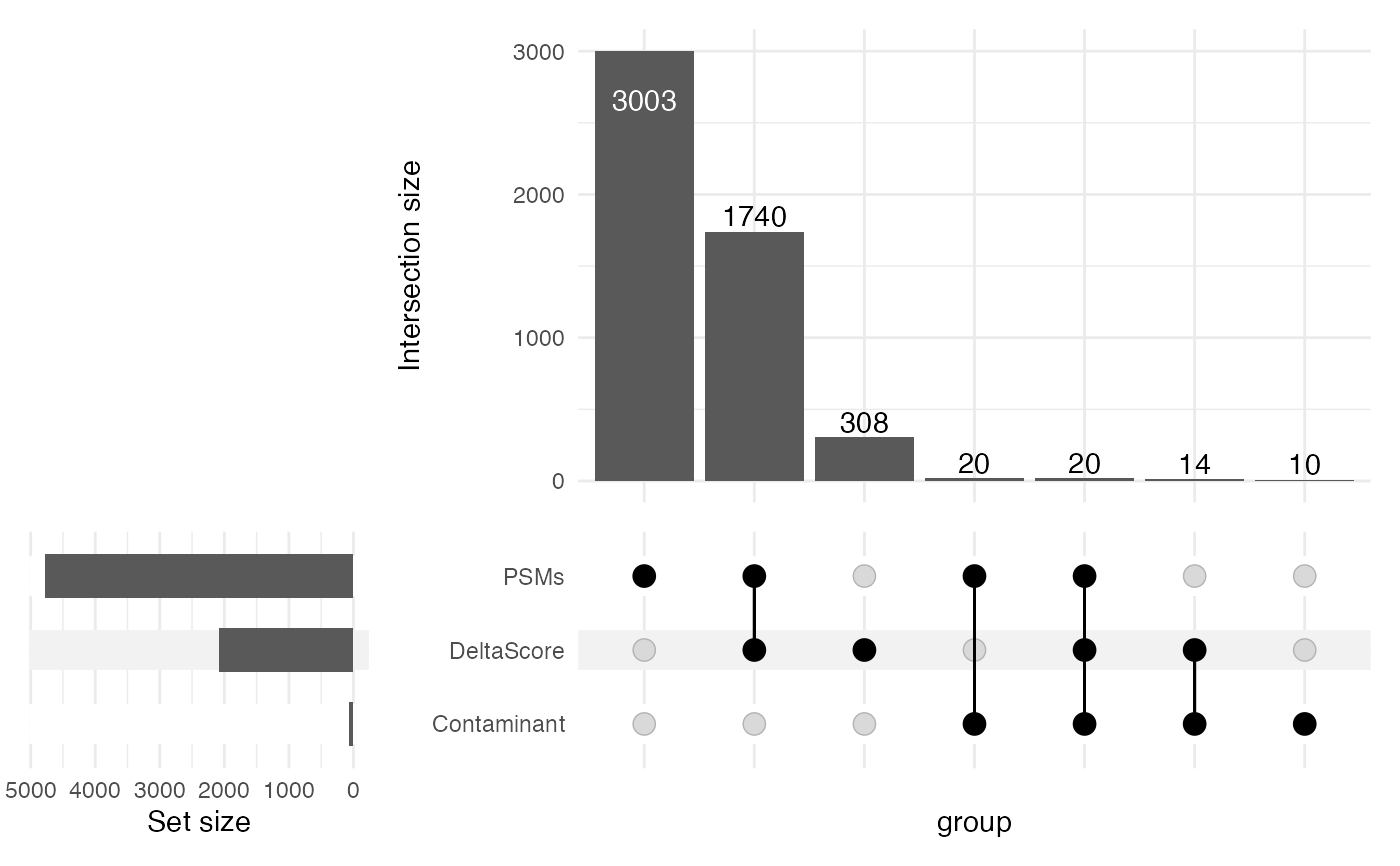
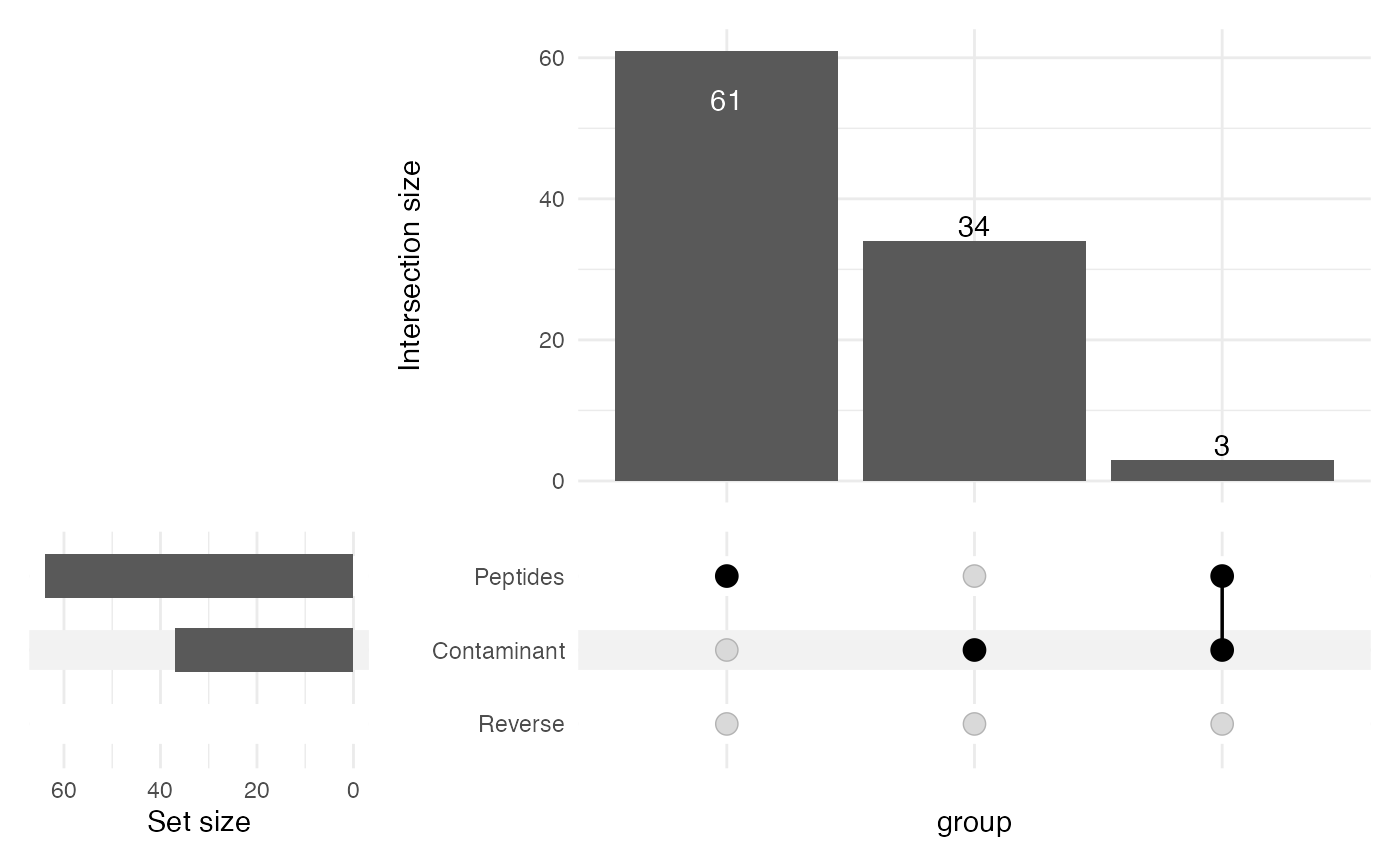
Logical scalar, whether to generate an UpSet plot detailing the reasons for features being filtered out. Only generated if any feature is in fact filtered out.
- exclFile
Character scalar, the path to a text file where the features that are filtered out are written. If
NULL(default), excluded features are not recorded.
Value
A filtered object of the same type as sce.
Examples
# MaxQuant
sce <- importExperiment(inFile = system.file("extdata", "mq_example",
"1356_proteinGroups.txt",
package = "einprot"),
iColPattern = "^LFQ.intensity.")$sce
dim(sce)
#> [1] 463 9
sce <- filterFeaturesSE(sce = sce, filtersSE = einprotMQFilters,
plotUpset = TRUE)
#> Warning: Using `size` aesthetic for lines was deprecated in ggplot2 3.4.0.
#> ℹ Please use `linewidth` instead.
#> ℹ The deprecated feature was likely used in the ComplexUpset package.
#> Please report the issue at
#> <https://github.com/krassowski/complex-upset/issues>.
 dim(sce)
#> [1] 231 9
# ProteomeDiscoverer, Proteins
sce <- importExperiment(
inFile = system.file("extdata", "pdtmt_example",
"Fig2_m23139_RTS_QC_varMods_Proteins.txt",
package = "einprot"),
iColPattern = "^Abundance.F.+.Sample.")$sce
dim(sce)
#> [1] 1723 16
sce <- filterFeaturesSE(sce = sce, filtersSE = einprotPDTMTProteinFilters,
plotUpset = TRUE)
dim(sce)
#> [1] 231 9
# ProteomeDiscoverer, Proteins
sce <- importExperiment(
inFile = system.file("extdata", "pdtmt_example",
"Fig2_m23139_RTS_QC_varMods_Proteins.txt",
package = "einprot"),
iColPattern = "^Abundance.F.+.Sample.")$sce
dim(sce)
#> [1] 1723 16
sce <- filterFeaturesSE(sce = sce, filtersSE = einprotPDTMTProteinFilters,
plotUpset = TRUE)
 dim(sce)
#> [1] 1087 16
# ProteomeDiscoverer, PeptideGroups
sce <- importExperiment(
inFile = system.file("extdata", "pdtmt_example",
"Fig2_m23139_RTS_QC_varMods_PeptideGroups.txt",
package = "einprot"),
iColPattern = "^Abundance.F.+.Sample.")$sce
dim(sce)
#> [1] 5756 16
sce <- filterFeaturesSE(sce = sce, filtersSE = einprotPDTMTPeptideGroupFilters)
dim(sce)
#> [1] 1087 16
# ProteomeDiscoverer, PeptideGroups
sce <- importExperiment(
inFile = system.file("extdata", "pdtmt_example",
"Fig2_m23139_RTS_QC_varMods_PeptideGroups.txt",
package = "einprot"),
iColPattern = "^Abundance.F.+.Sample.")$sce
dim(sce)
#> [1] 5756 16
sce <- filterFeaturesSE(sce = sce, filtersSE = einprotPDTMTPeptideGroupFilters)
 dim(sce)
#> [1] 641 16
# FragPipe
sce <- importExperiment(inFile = system.file("extdata", "fp_example",
"combined_protein.tsv",
package = "einprot"),
iColPattern = ".MaxLFQ.Intensity$")$sce
dim(sce)
#> [1] 453 9
sce <- filterFeaturesSE(sce = sce, filtersSE = einprotFragPipeFilters,
plotUpset = TRUE)
dim(sce)
#> [1] 641 16
# FragPipe
sce <- importExperiment(inFile = system.file("extdata", "fp_example",
"combined_protein.tsv",
package = "einprot"),
iColPattern = ".MaxLFQ.Intensity$")$sce
dim(sce)
#> [1] 453 9
sce <- filterFeaturesSE(sce = sce, filtersSE = einprotFragPipeFilters,
plotUpset = TRUE)
 dim(sce)
#> [1] 355 9
dim(sce)
#> [1] 355 9