Run PCA and generate plots
doPCA.RdApply PCA to the assay defined by assayName and extract the top
ncomponent components. For each pair defined in plotpairs,
generate a collection of plots.
Arguments
- sce
A
SingleCellExperimentobject.- assayName
Character scalar defining the assay in
sceto use for the PCA.- ncomponents
Numeric scalar, the (maximal) number of components to extract. The actual number can be lower if the number of samples is too small.
- ntop
Number of features (with highest variance) to use to generate the PCA. Will be passed on to
scater::runPCA.- plotpairs
A list of numeric vectors of length 2, indicating which pairs of PCs to generate plots for.
- maxNGroups
Numeric scalar, the maximum number of groups to display in the legend in the scatter plot in the combined plot. If there are more than
maxNGroupsgroups, the legend is suppressed.- maxTextWidthBarplot
Numeric scalar giving the maximum allowed width for text labels in the bar plot of log-fold changes. If not
NULL, the size of the labels will be scaled down in an attempt to keep the labels inside the canvas. Typically set to half the width of the plot device (in inches).- colourBy
Character scalar indicating the name of the column of
colData(sce)that will be used to colour the points.- subset_row
Vector specifying the subset of features to use for dimensionality reduction. Can be a character vector of row names, an integer vector of row indices or a logical vector. Will be passed to
scater::runPCA.- scale
Logical scalar indicating whether the values should be scaled before the PCA is applied. Will be passed to
scater::runPCA.
Value
A list with the following components:
sce- the input sce, expanded with the calculated PCs, in addition the feature coefficients will be added to the
rowData.plotcoord- a list of
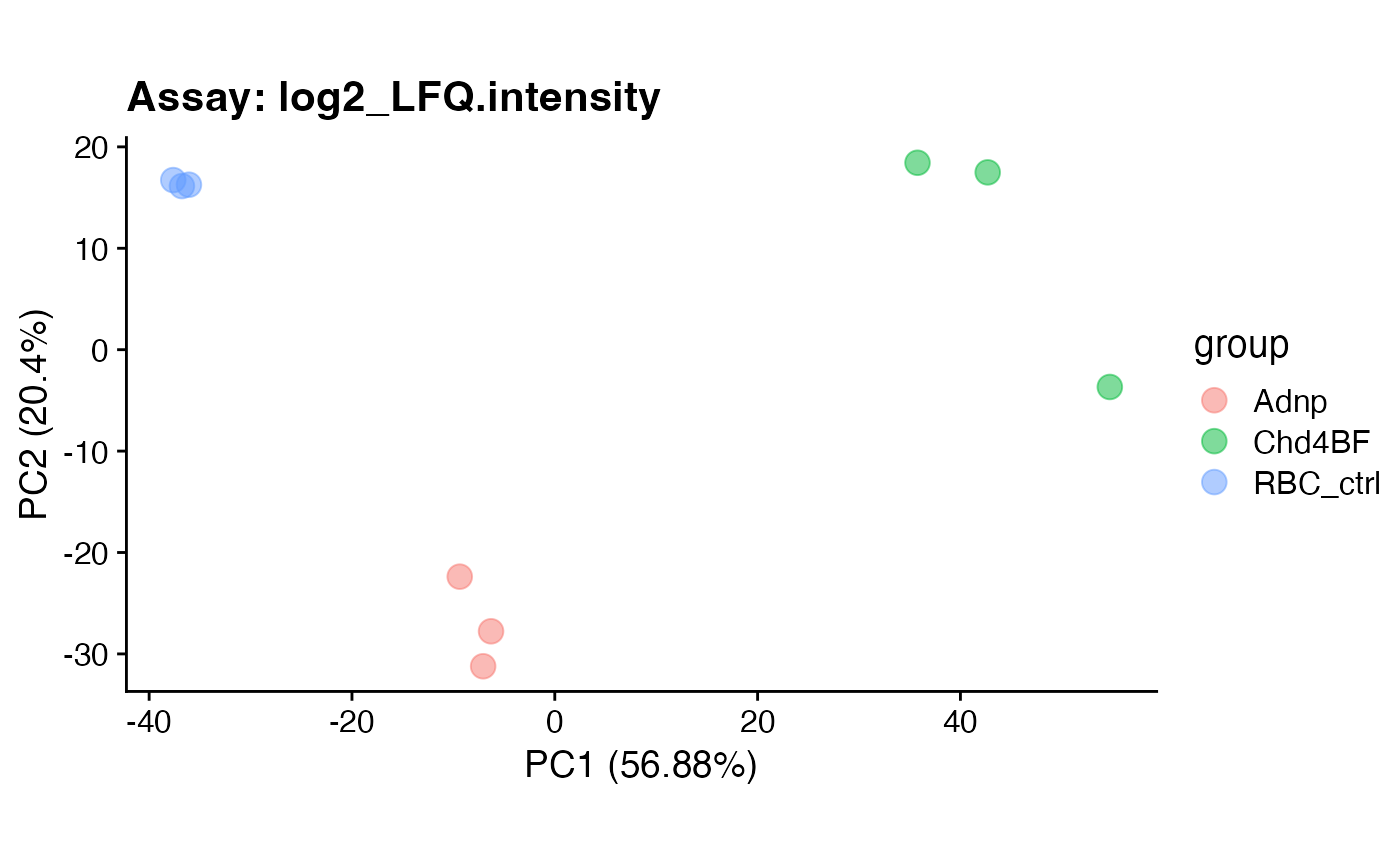
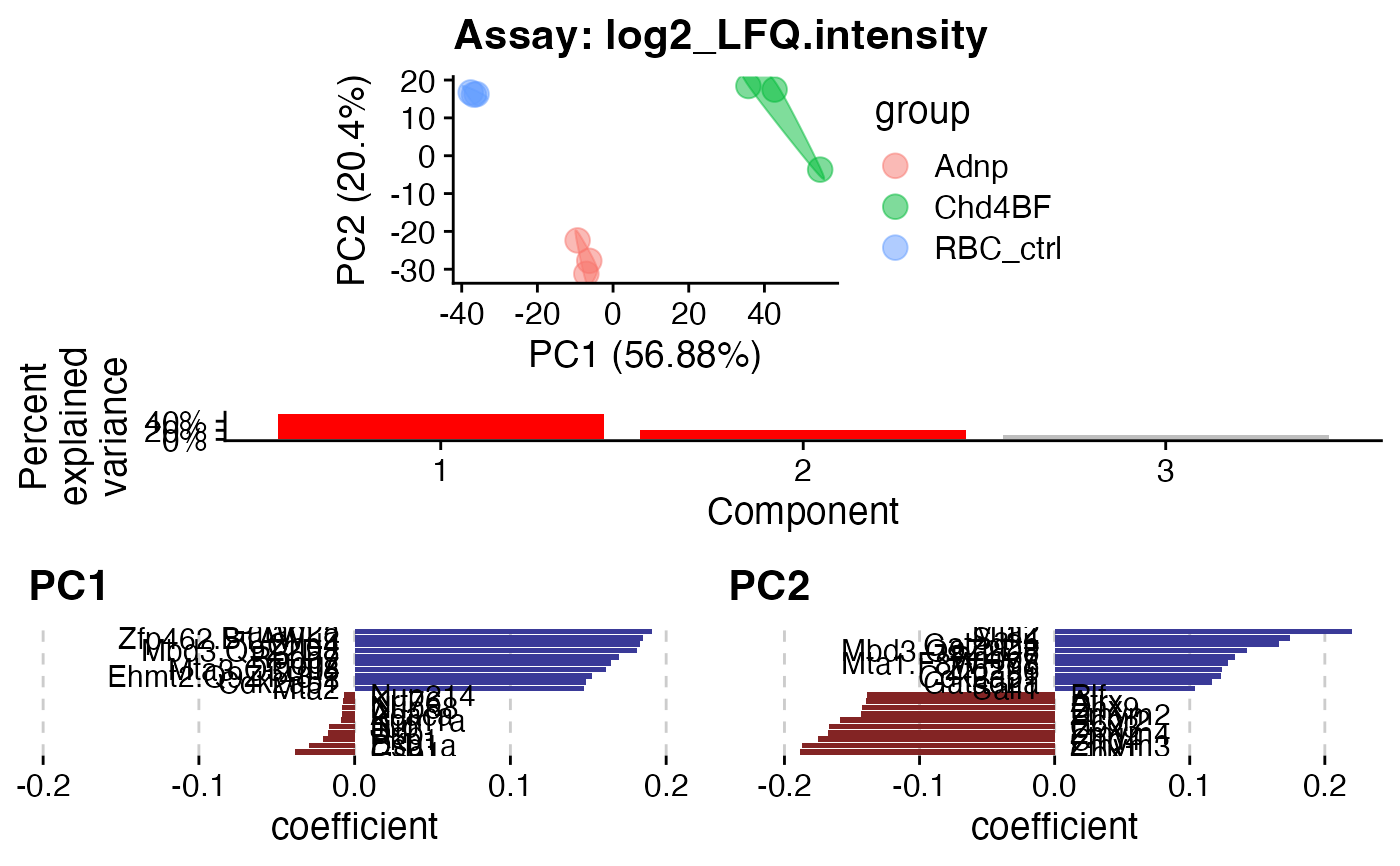
ggplotobjects containing coordinate plots for the desired pairs of components.plotcombined- a list of
ggplotobjects containing combined coordinate, scree and coefficient plots for the desired pairs of components.plotpairs- a
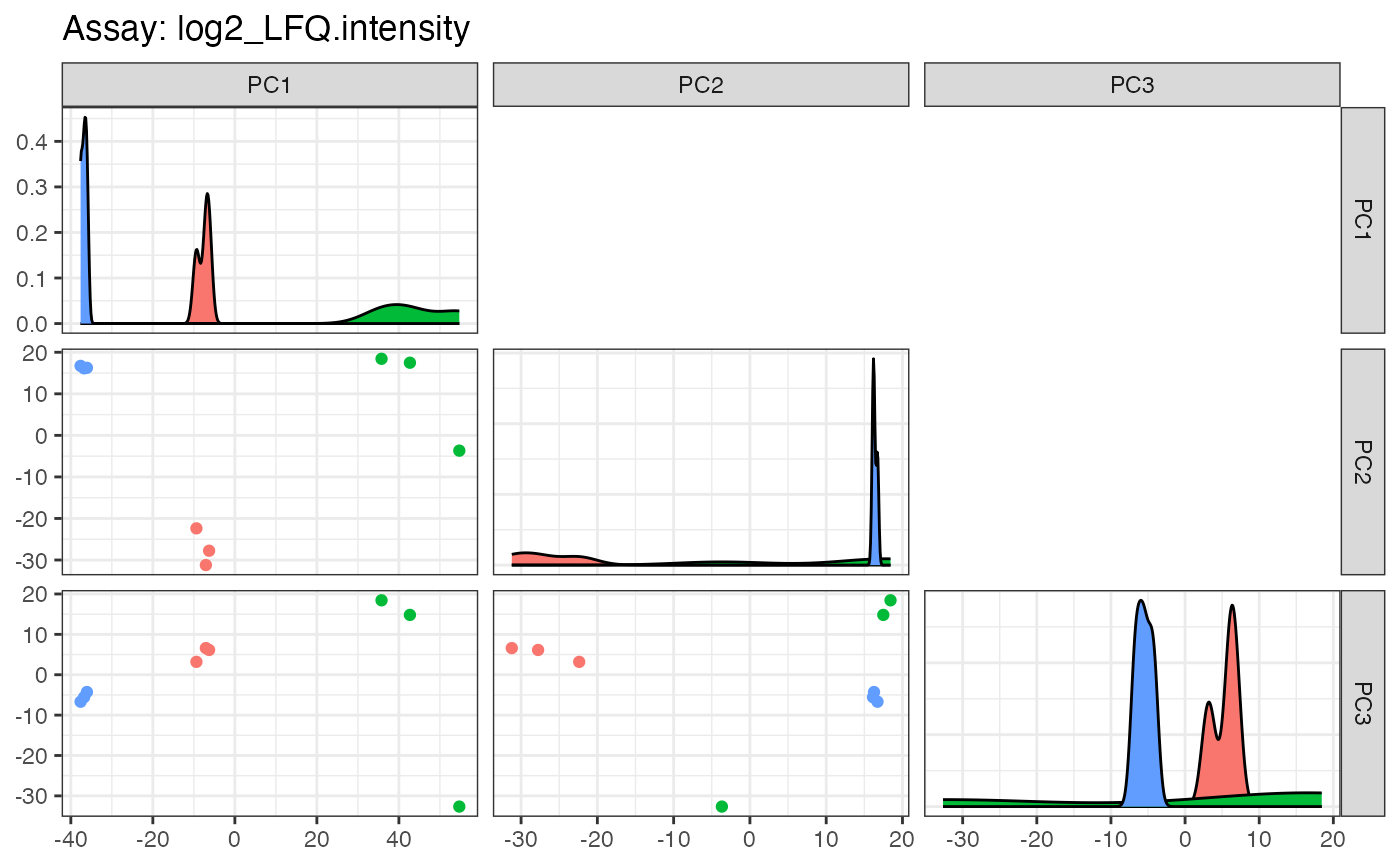
ggpairsplot with all extracted components.
Examples
sce <- readRDS(system.file("extdata", "mq_example", "1356_sce.rds",
                           package = "einprot"))
pca <- doPCA(sce, assayName = "log2_LFQ.intensity", ncomponents = 3)
pca$plotcoord$PC1_2

pca$plotcombined$PC1_2

pca$plotpairs
