Visualize the gene model for a gene of interest, or for all genes in a provided region, and/or show one or more coverage tracks based on bigwig file(s).
plotGeneRegion(
  gtf = "",
  granges = NULL,
  chr = "",
  start = NA_real_,
  end = NA_real_,
  showgene = "",
  bigwigFiles = "",
  bigwigCond = "",
  geneTrackTitle = "Genes",
  transcriptIdColumn = "transcript_id",
  geneIdColumn = "gene_id",
  geneSymbolColumn = "gene_name",
  lowerPadding = 0.15,
  upperPadding = 0.05,
  colorByStrand = FALSE,
  featureColors = c(plusmain = "#0E14D0", minusmain = "#D0350E", plusother = "#9E9BEB",
    minusother = "#DA907E"),
  condColors = NULL,
  scaleDataTracks = FALSE,
  plotTitle = NULL,
  ...
)
Arguments
- gtf
Character scalar, path to gtf file (tested with Ensembl/Gencode files).
- granges
GRanges object, typically generated from a GTF file using the
prepareGTFfunction. This is an alternative to providing the link to the gtf file directly, and will take precedence over thegtfargument if provided.- chr
Character scalar, name of the chromosome to show.
- start, end
Numeric scalars, start and end position of the region to show.
- showgene
Character scalar, the gene ID/name to display. Will take precedence over positional range specification if provided.
- bigwigFiles
Named character vector, paths to bigwig files.
- bigwigCond
Named character vector, the grouping of the bigwig files (used for coloring of the coverage tracks).
- geneTrackTitle
Character scalar, name of the gene track.
- transcriptIdColumn
Character scalar, the column in the gtf file that contains the transcript ID. Passed to
prepareGTF.- geneIdColumn
Character scalar, the column in the gtf file that contains the gene ID. Passed to
prepareGTF.- geneSymbolColumn
Character scalar, the column in the gtf file that contains the gene symbol (if available). Set to
""if not available (in which case the gene IDs will be used in its place). Passed toprepareGTF.- lowerPadding, upperPadding
Numeric scalars, setting the amount of padding in the lower and upper range of the plot, respectively. For example, a value of 0.05 will expand the range by 0.05 * (max coordinate - min coordinate) in the specified direction.
- colorByStrand
Logical scalar, determining whether gene features are colored by the annotated strand.
- featureColors
Named character vector of length 4, with elements
plusmain,minusmain,plusother,minusother, giving the colors to use for the features ifcolorByStrandis TRUE.- condColors
Either NULL or a named character vector (with the same names as the unique values of
bigwigCond), giving the colors to use for the coverage tracks ifbigwigCondis provided.- scaleDataTracks
Logical scalar, indicating whether the data tracks should be scaled to have the same y-axis limits.
- plotTitle
Character scalar, the title of the final plot. If
NULL(the default), it will be automatically defined based on the displayed gene or region.- ...
Additional arguments to be passed to
Gviz::plotTracks.
Details
The gene annotation can be provided either as a path to a gtf file, or as a
GRanges object (generated using the prepareGTF function to ensure
compatibility). The region to display can be determined either by
specifying a gene (ID or symbol) or by specifying a viewing range
(chromosome, start and end positions).
Examples
if (requireNamespace("Gviz", quietly = TRUE)) {
gtffile <- system.file("extdata/plotGeneRegion/mm10_ensembl98.gtf",
package = "swissknife")
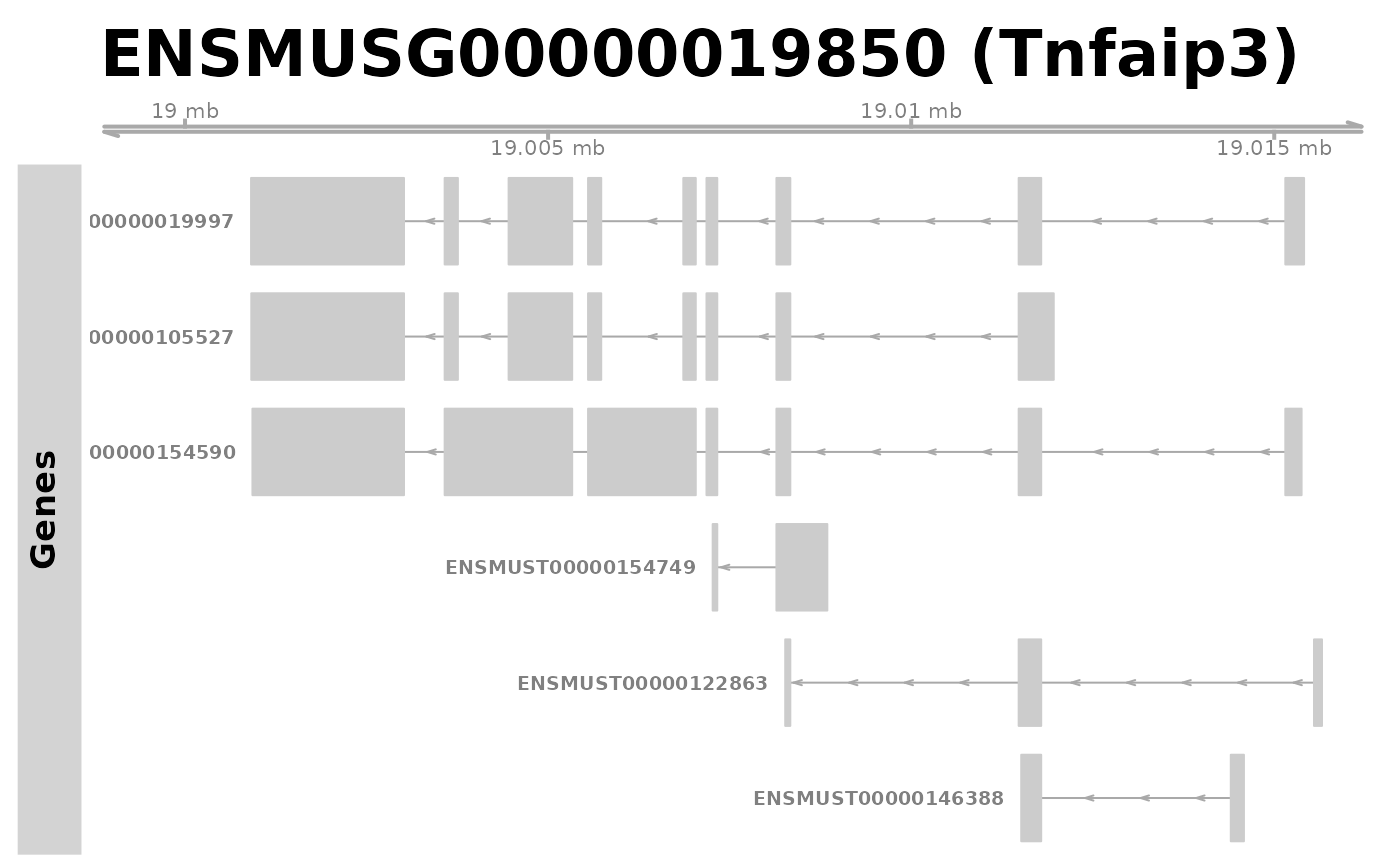
plotGeneRegion(gtf = gtffile,
showgene = "Tnfaip3")
bwf <- system.file("extdata/plotGeneRegion/mnase_mm10.bw",
package = "swissknife")
names(bwf) <- "bwf1"
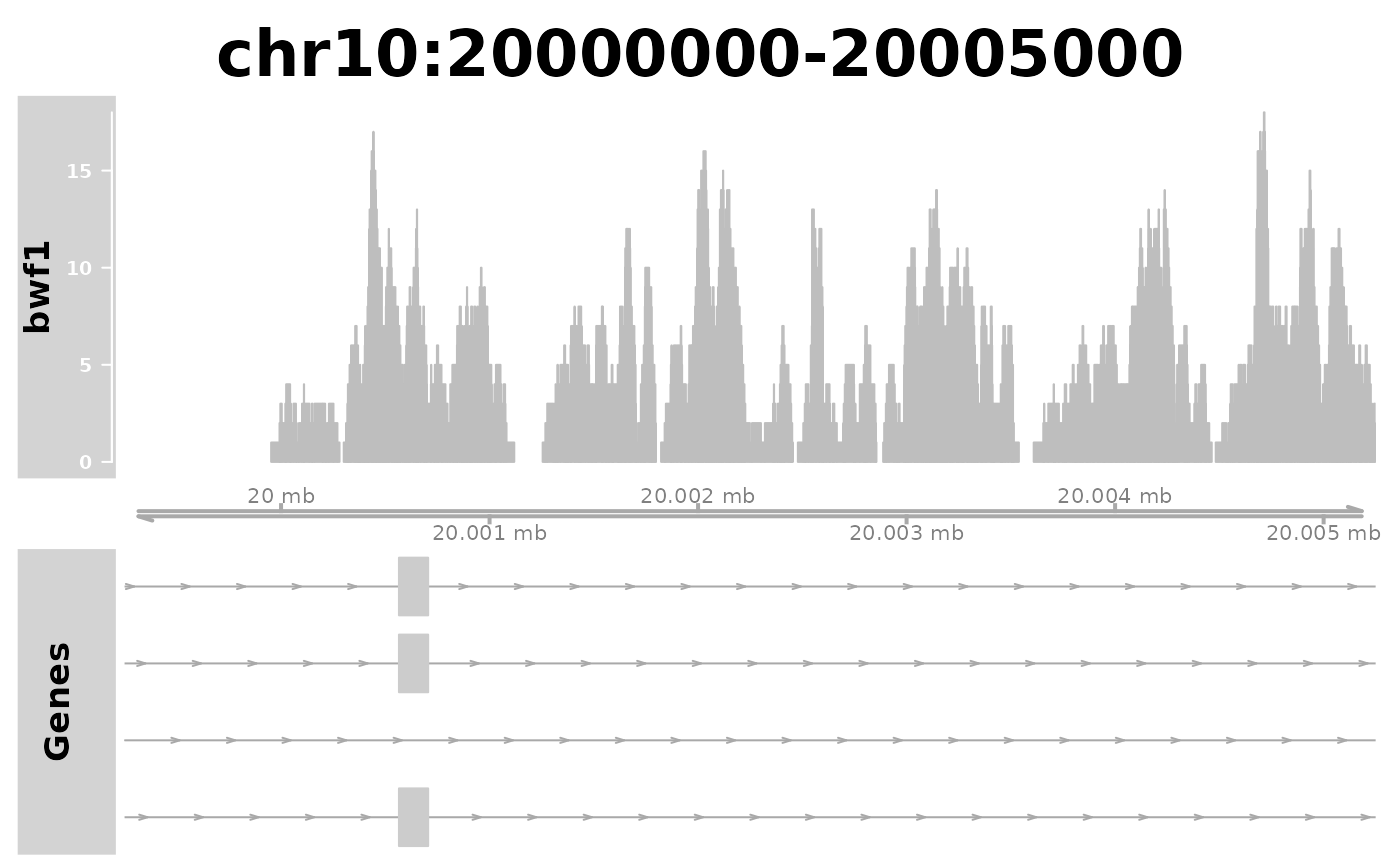
plotGeneRegion(gtf = gtffile,
bigwigFiles = bwf,
chr = "chr10", start = 20000000, end = 20005000)
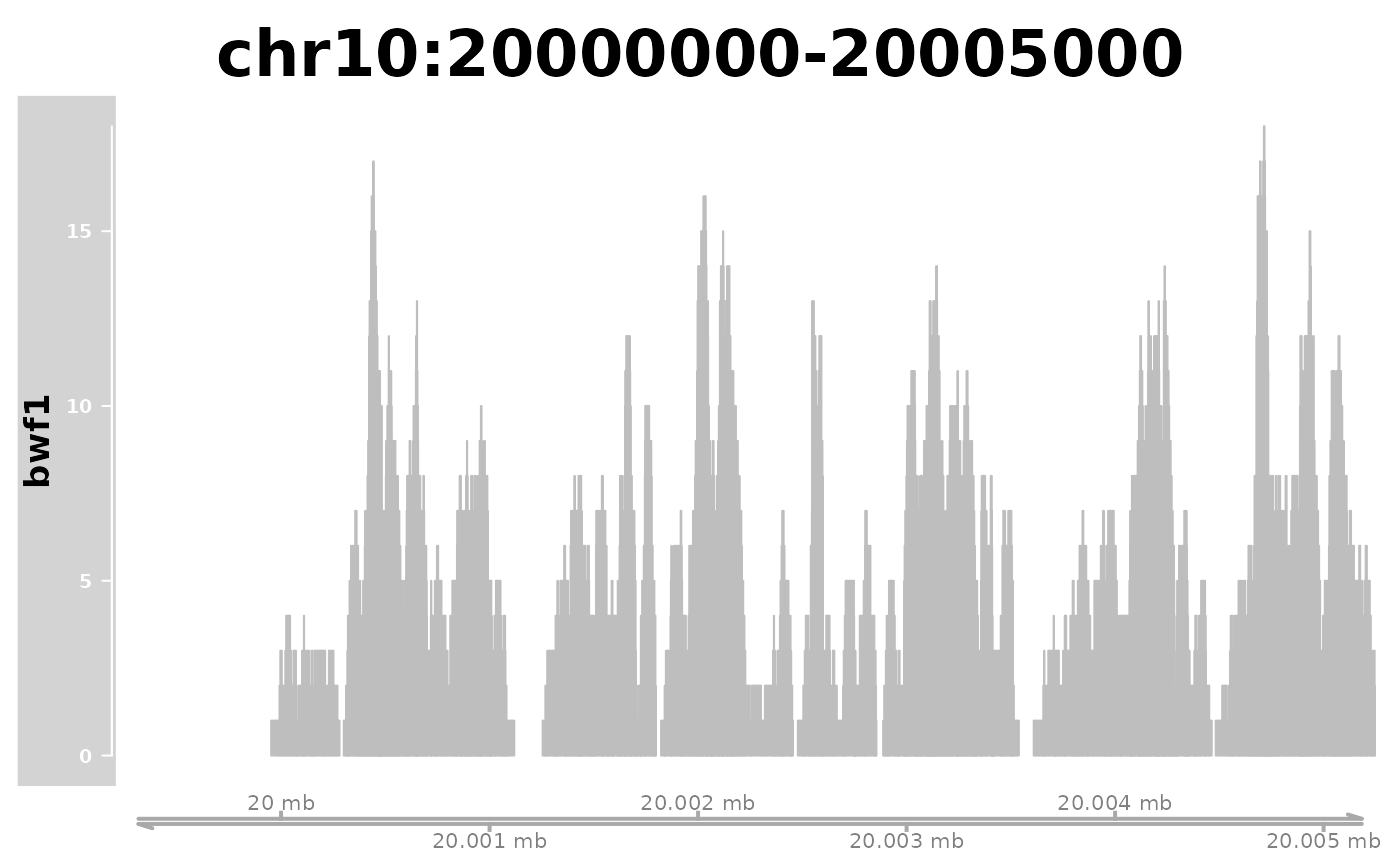
plotGeneRegion(bigwigFiles = bwf,
chr = "chr10", start = 20000000, end = 20005000)
bwf2 <- c(bwf, bwf)
names(bwf2) <- c("bwf1", "bwf2")
bwc2 <- c("c1", "c2")
names(bwc2) <- names(bwf2)
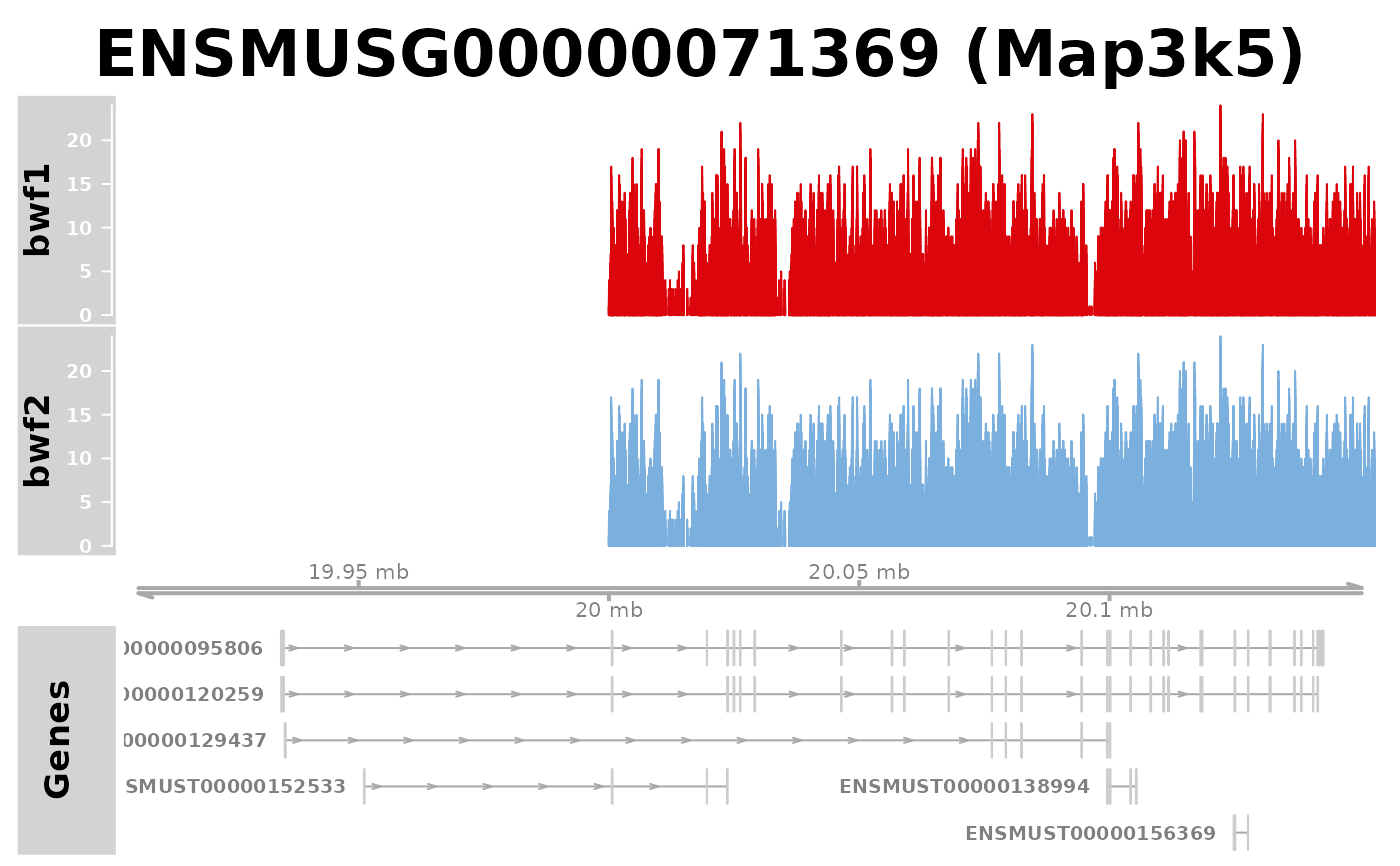
plotGeneRegion(gtf = gtffile, bigwigFiles = bwf2, bigwigCond = bwc2,
showgene = "Map3k5")
}