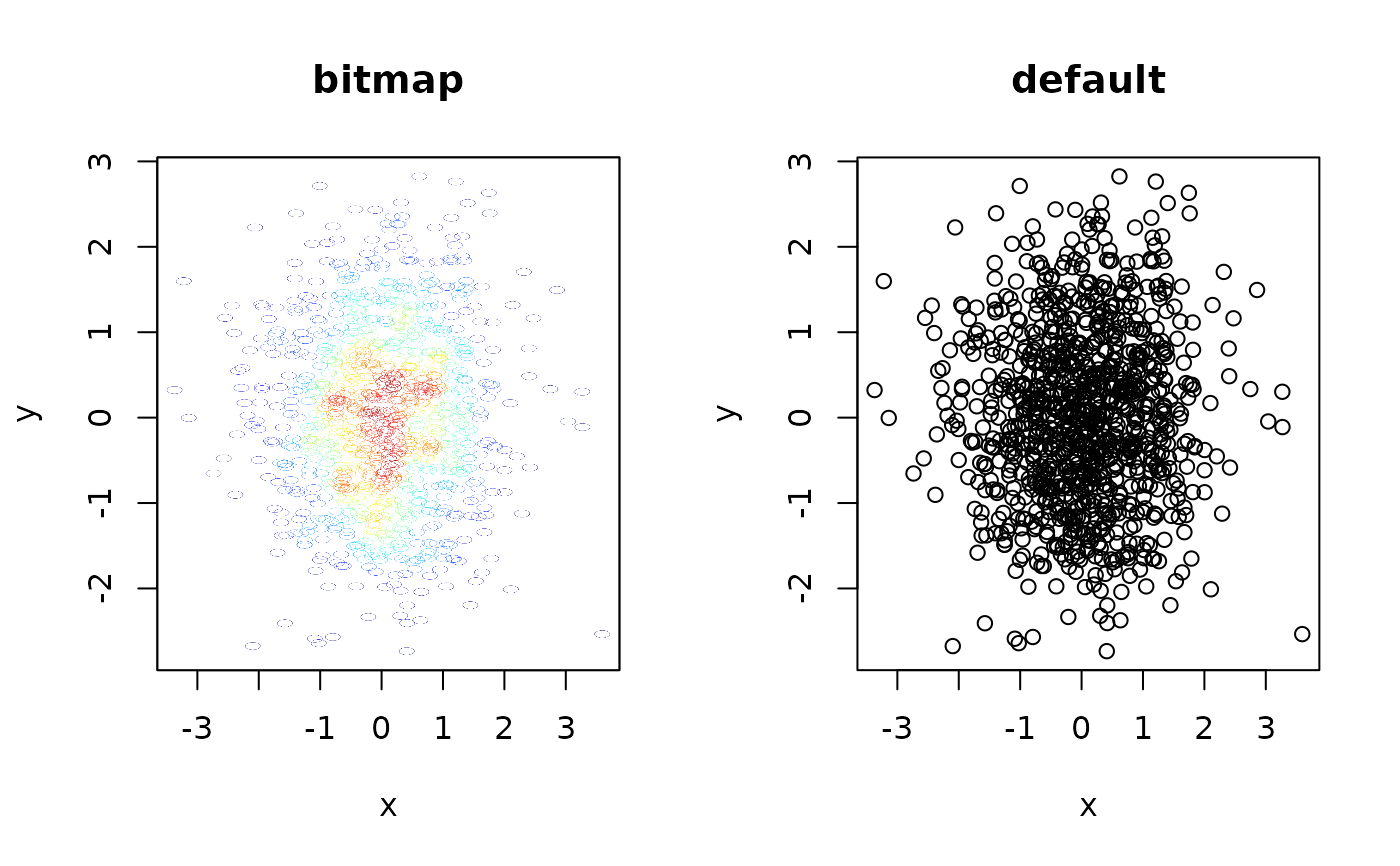
plotBitScatter is a wrapper around plot which renders the
plot area as a bitmap (png), but keeps all other elements (axes, labels, etc.)
as vector elements. This is especially useful for keeping the size of PDF files
with scatter plots with many elements small, while retaining editability of axes.
plotBitScatter(
  x,
  y = NULL,
  ...,
  densCols = TRUE,
  colpal = c("#00007F", "blue", "#007FFF", "cyan", "#7FFF7F", "yellow", "#FF7F00", "red",
    "#7F0000"),
  xpixels = 1000,
  ypixels = NULL,
  pointsize = NULL
)
Arguments
- x
numericvector with x-coordinates of points, or a two-column matrix with x- and y- coordinates.- y
numericvector with y-coordinates of points (same length asx). Can beNULL, in which casexmust be a two-column matrix.- ...
any further arguments to be passed to
plot- densCols
logical(1). IfTRUEandcolis not given as an additional argument, then the local density of points will be used as colors, using the palette spanned by the colors incolpal.- colpal
vector of colors defining the palette for automatic density-based coloring.
- xpixels
the number of pixels in the x dimension used for rendering the plotting area.
- ypixels
the number of pixels in the y dimension used for rendering the plotting area. If
NULL(the default), will be calculated automatically asxpixels * par('pin')[2] / par('pin')[1], such that the aspect ratio of the current plotting region is observed. This may not work (e.g. when usinglayout()), as this may result in negative values returned bypar('pin'). In that case,ypixelsshould be set manually using this argument.- pointsize
the size of points used for the png device when rendering the plot. If
NULL(the default), will be calculated automatically as12 / graphics::grconvertX(par("pin")[1], from = "inches", to = "device") * xpixels. This may not work (e.g. when usinglayout()), as this may result in negative values returned bypar('pin'). In that case,pointsizeshould be set manually using this argument.
Value
NULL (invisibly)
Details
xpixels controls the resolution of the rendered plotting area.
In order to keep circular plotting symbols circlular (e.g. pch = 1),
ypixels is automatically calculated using xpixels and the
aspect ratio of the current plotting area. If the plotting device is
rescaled after calling plotBitScatter, circular plotting symbols
may become skewed.