Compare the compositions of a data set and a subset
Source:R/compareCompositionPlot.R
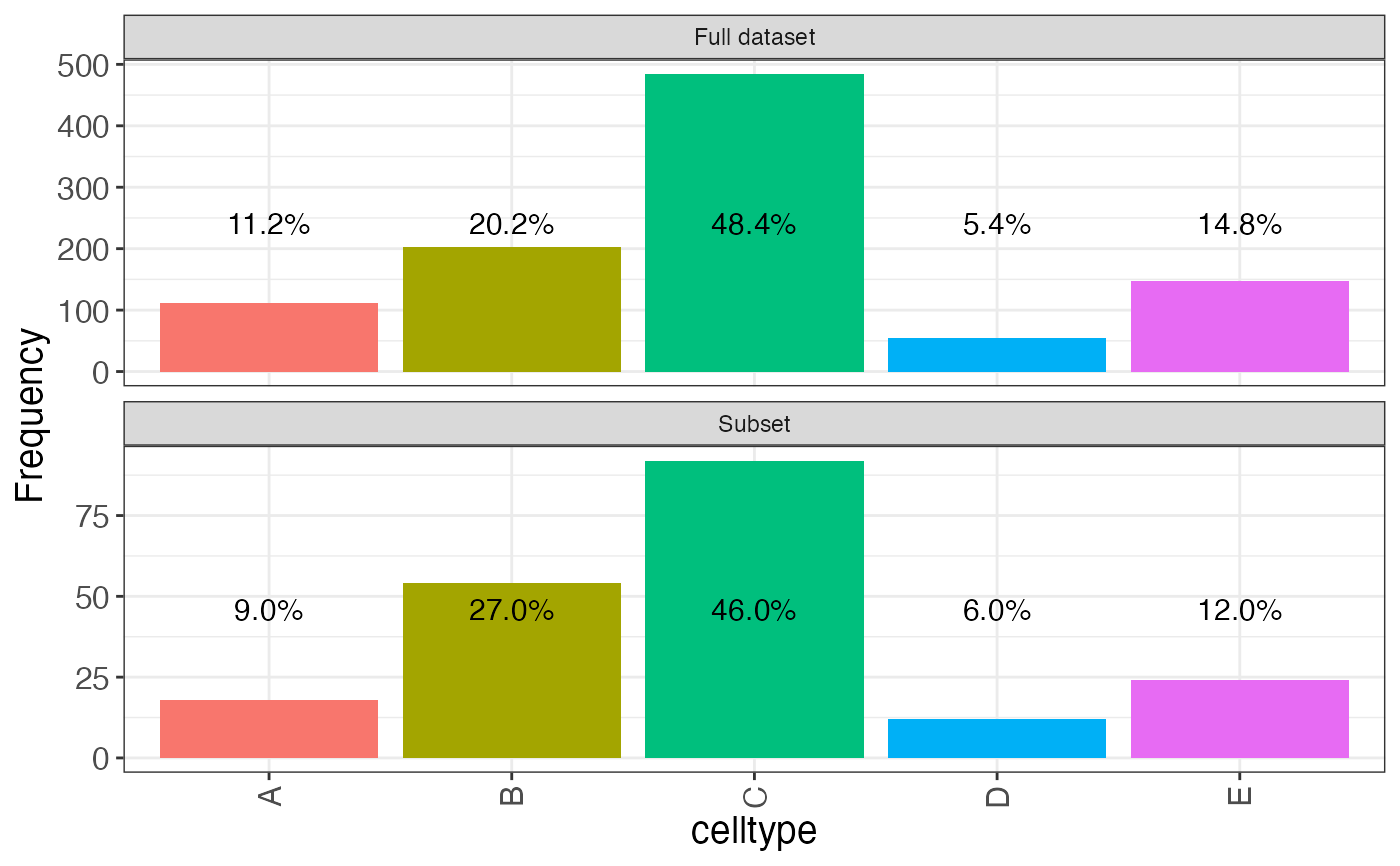
compareCompositionPlot.RdPlot the composition of a data set (e.g., the number of cells from each cell type) and contrast it with the corresponding composition of a subset.
compareCompositionPlot(
  df,
  idx,
  column,
  showPercentages = TRUE,
  fontSizePercentages = 4
)
Arguments
- df
A
data.frame-like object (such thatdf[[column]]works).- idx
A numeric vector representing the row indexes of
dfcorresponding to the subset of interest. Can also be a named list of index vectors if multiple subsets are of interest.- column
A character scalar corresponding to a column of
dfand representing the variable for which the composition should be calculated.- showPercentages
Logical scalar, indicating whether relative frequencies of each category should be shown in the plot.
- fontSizePercentages
Numerical scalar, indicating the font size of the relative frequencies, if
showPercentagesisTRUE.
Value
A ggplot object.
Examples
df <- data.frame(celltype = sample(LETTERS[1:5], 1000, replace = TRUE,
                                   prob = c(0.1, 0.2, 0.5, 0.05, 0.15)))
idx <- sample(seq_len(1000), 200)
compareCompositionPlot(df, idx, "celltype")